- NXP Forums
- Product Forums
- General Purpose MicrocontrollersGeneral Purpose Microcontrollers
- i.MX Forumsi.MX Forums
- QorIQ Processing PlatformsQorIQ Processing Platforms
- Identification and SecurityIdentification and Security
- Power ManagementPower Management
- MCX Microcontrollers
- S32G
- S32K
- S32V
- MPC5xxx
- Other NXP Products
- Wireless Connectivity
- S12 / MagniV Microcontrollers
- Powertrain and Electrification Analog Drivers
- Sensors
- Vybrid Processors
- Digital Signal Controllers
- 8-bit Microcontrollers
- ColdFire/68K Microcontrollers and Processors
- PowerQUICC Processors
- OSBDM and TBDML
-
- Solution Forums
- Software Forums
- MCUXpresso Software and ToolsMCUXpresso Software and Tools
- CodeWarriorCodeWarrior
- MQX Software SolutionsMQX Software Solutions
- Model-Based Design Toolbox (MBDT)Model-Based Design Toolbox (MBDT)
- FreeMASTER
- eIQ Machine Learning Software
- Embedded Software and Tools Clinic
- S32 SDK
- S32 Design Studio
- Vigiles
- GUI Guider
- Zephyr Project
- Voice Technology
- Application Software Packs
- Secure Provisioning SDK (SPSDK)
- Processor Expert Software
-
- Topics
- Mobile Robotics - Drones and RoversMobile Robotics - Drones and Rovers
- NXP Training ContentNXP Training Content
- University ProgramsUniversity Programs
- Rapid IoT
- NXP Designs
- SafeAssure-Community
- OSS Security & Maintenance
- Using Our Community
-
-
- Home
- :
- Product Forums
- :
- S12 / MagniV Microcontrollers
- :
- [S12 Debugging] I Can't debug in Codewarior
[S12 Debugging] I Can't debug in Codewarior
- Subscribe to RSS Feed
- Mark Topic as New
- Mark Topic as Read
- Float this Topic for Current User
- Bookmark
- Subscribe
- Mute
- Printer Friendly Page
[S12 Debugging] I Can't debug in Codewarior
- Mark as New
- Bookmark
- Subscribe
- Mute
- Subscribe to RSS Feed
- Permalink
- Report Inappropriate Content
Dear friends I have an urgent question.
I can't debug one of the projects on S12 processor. On one project everything is working excellent but on the other something might be wrong with Processor Expert's settings. I can setup a breakpoint, but I can't stop the program on that breakpoint even if it is in the main function. I can check dynamically the variables so debugging should be possible. I can stop the processor via debugger but than I can't step in/over or go/continue once again. Sometimes the debugger is able to catch the breakpoint but only for a few seconds. I checked everything, have changed the interrupts I read already everything connected with debugging in CodeWarior that I found in the internet. I checked the project on other boards so a processor and the board aren't damaged. Can you please tell me what could cause my problem.
Please help me I can't work without debuging
Jacek
I read :
http://www.nxp.com/files/soft_dev_tools/doc/ref_manual/CW_Debugger_HC12_RM.pdf didn't help
- Mark as New
- Bookmark
- Subscribe
- Mute
- Subscribe to RSS Feed
- Permalink
- Report Inappropriate Content
Hi Jacek,
what exact S12 MCU do you use?
Does the same happen if you disable interrupts?
It's very probable that PE tool is causing such unexpected behavior of the debugger.
Is it possible for you to share the project so we can review?
Regards,
iggi
- Mark as New
- Bookmark
- Subscribe
- Mute
- Subscribe to RSS Feed
- Permalink
- Report Inappropriate Content
1. Processor is MC9S12XET256.
2. Disable interrupts in debugger options or disable interrupts in firmware? if in debugger, that it doesn't help.
3. I can send you project configuration on email (if you will provide me)
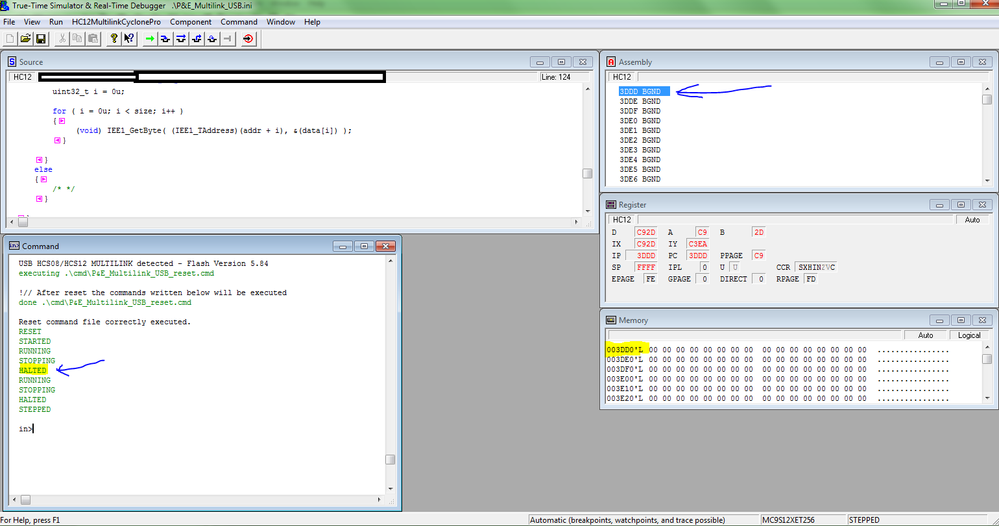
4. I've attached screenshot - first try to stop program was unsuccesful - it goes automatically again.
Second stop was correct, but after one step, program jumps to zeroed memory and I've get ILLEGAL_BP.
This is typical behaviour in this project. I have other project where I can debug smoothly, but there are many differences, e.g. no FreeRTOS.
- Mark as New
- Bookmark
- Subscribe
- Mute
- Subscribe to RSS Feed
- Permalink
- Report Inappropriate Content
Hi Jacek,
well, it's better to disable interrupts in firmware, just comment out EnableInterrupts; codeline or type in DisableInterrupts;
But, this might not be much of help since you are using RTOS which uses the interrupts a lot.
Now, looking at the screenshot, the code stucked in RAM. So, not sure if it caused by RTOS itself.
We think that the issue is with pointers and/or addressing. For example, the program is pointed to an _far address (RPAGE, PPAGE or GPAGE), but the pointer value is missing high byte.
The Illegal_BP is a typical SW thing. It means the debugger lost (MCU behavior is different from behavior which debugger expects).
Typical root cause is unexpected interrupt or BDM communication is down. This is usually generated by the following causes:
_ unmapped interrupt vectors
_ watchdogs
_ jump, read or write to unimplemented addresses (could be due to inappropriate libraries).
_ stack overflow
Regards,
iggi
