- NXP Forums
- Product Forums
- General Purpose MicrocontrollersGeneral Purpose Microcontrollers
- i.MX Forumsi.MX Forums
- QorIQ Processing PlatformsQorIQ Processing Platforms
- Identification and SecurityIdentification and Security
- Power ManagementPower Management
- MCX Microcontrollers
- S32G
- S32K
- S32V
- MPC5xxx
- Other NXP Products
- Wireless Connectivity
- S12 / MagniV Microcontrollers
- Powertrain and Electrification Analog Drivers
- Sensors
- Vybrid Processors
- Digital Signal Controllers
- 8-bit Microcontrollers
- ColdFire/68K Microcontrollers and Processors
- PowerQUICC Processors
- OSBDM and TBDML
-
- Solution Forums
- Software Forums
- MCUXpresso Software and ToolsMCUXpresso Software and Tools
- CodeWarriorCodeWarrior
- MQX Software SolutionsMQX Software Solutions
- Model-Based Design Toolbox (MBDT)Model-Based Design Toolbox (MBDT)
- FreeMASTER
- eIQ Machine Learning Software
- Embedded Software and Tools Clinic
- S32 SDK
- S32 Design Studio
- Vigiles
- GUI Guider
- Zephyr Project
- Voice Technology
- Application Software Packs
- Secure Provisioning SDK (SPSDK)
- Processor Expert Software
-
- Topics
- Mobile Robotics - Drones and RoversMobile Robotics - Drones and Rovers
- NXP Training ContentNXP Training Content
- University ProgramsUniversity Programs
- Rapid IoT
- NXP Designs
- SafeAssure-Community
- OSS Security & Maintenance
- Using Our Community
-
-
- Home
- :
- MCUXpresso Software and Tools
- :
- Kinetis Design Studio
- :
- Unexplained faults/resets following a peculiar pattern... [KDS on OSX, JLink]
Unexplained faults/resets following a peculiar pattern... [KDS on OSX, JLink]
- Subscribe to RSS Feed
- Mark Topic as New
- Mark Topic as Read
- Float this Topic for Current User
- Bookmark
- Subscribe
- Mute
- Printer Friendly Page
Unexplained faults/resets following a peculiar pattern... [KDS on OSX, JLink]
- Mark as New
- Bookmark
- Subscribe
- Mute
- Subscribe to RSS Feed
- Permalink
- Report Inappropriate Content
So I've been developing for about a week, and braving some odd behavior... Initially I assumed it was down to dodgy peripheral settings, but I've now got its repeatability down to a fine art
I'm building a MK20D10 project with GCC on KDS / KSDK1.3 on OSX El Capitan, debugging with a JLink with default settings. I have created projects from scratch and see very similar behavior, so I don't think it's related to any particular peripheral or KSDK component, but I can't be 100% sure.
SO:-
Every time I make a change to a source file (i.e. a ".c" file), I BUILD, and it compiles successfully... I then hit the DEBUG button (the little bug), it connects to the JLink and fires up the microcontroller. All looks fine.
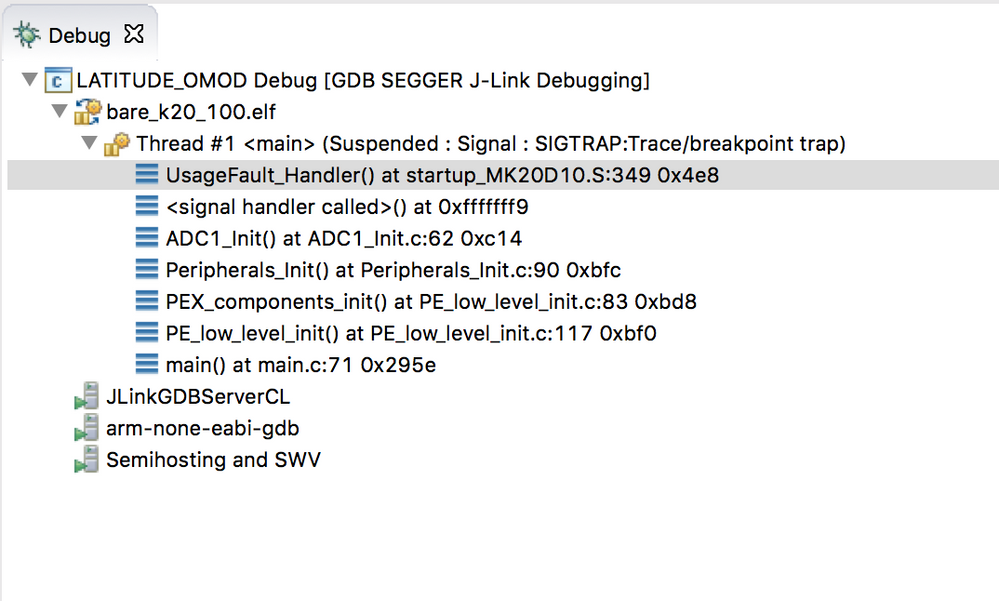
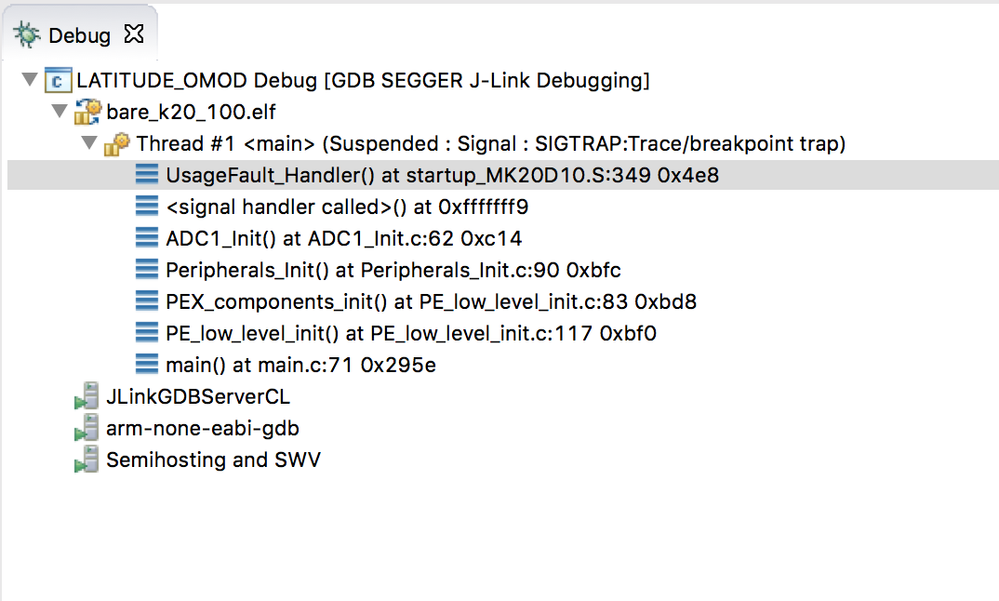
But then (i.e. on the first 'debug' after any change to a ".c" file), every single time, I will get this...
The location of the fault will vary, and usually goes to the default IRQ.
If I hit DEBUG again, and/or recompile then debug... I can get no change in behavior.
At this point, I do this trick...
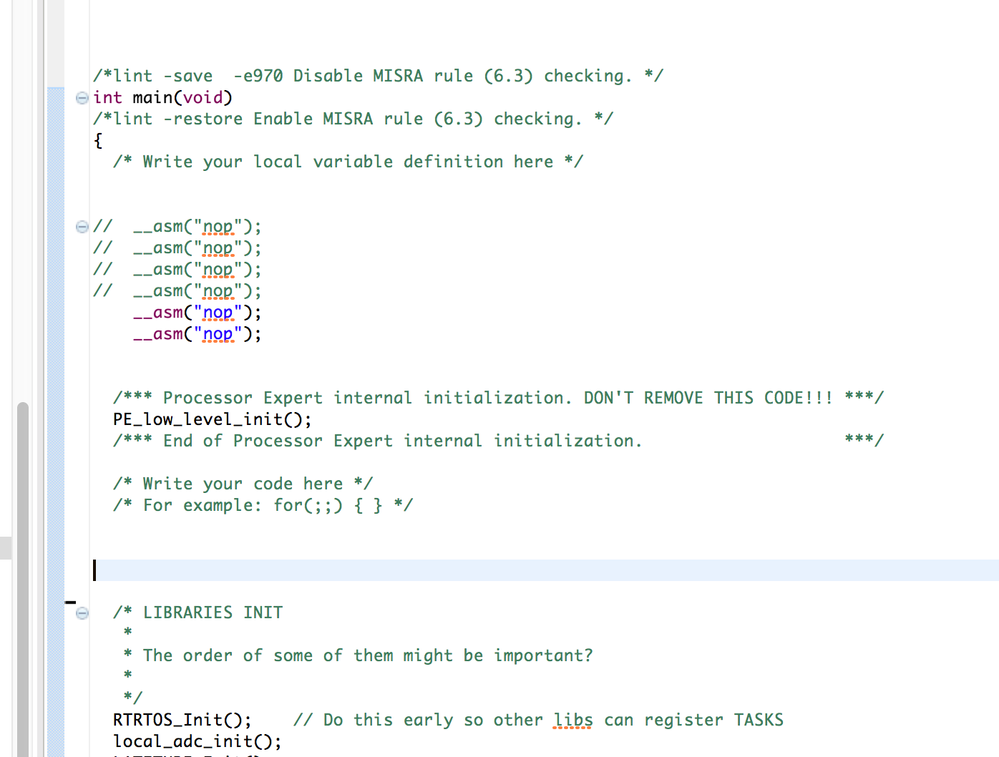
I comment (or uncomment) some of __asm("nop") instructions.
90% of the time this works and I go to the next step (below).... but occasionally I need to give it a different number of NOPs.
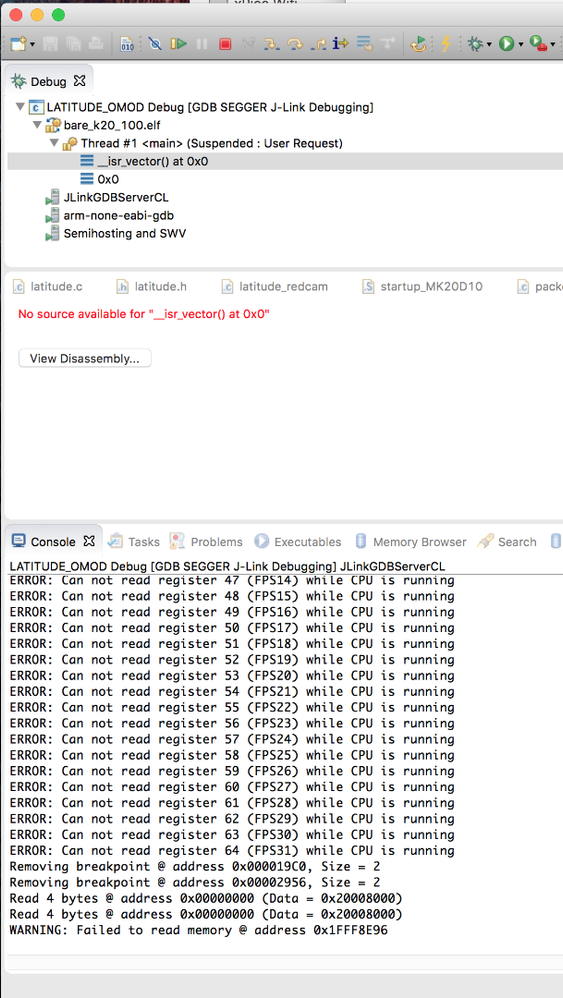
Then I get this....
But that's OK, I know I'm one step away from running.....
I hit STOP, then DEBUG again..... And it boots perfectly.
At this point I can debug, breakpoint, reset, anything I want... I can even STOP and start the debug again. Everything is OK until I change a ".c" file.
What on earth is going on? Any ideas where to look?
I can work like this, just, but the time it takes to 'make a change' => 'run the app' is frustrating. I'm literally commenting and un-commenting NOPs with every run, and it works around the problem.
I've tried changing the optimisation level, also I've tried changing some clock settings (CPU speed, oscillator capacitive load, JLink debug speed, etc.) which didn't help.
Any ideas?
Kris
- Mark as New
- Bookmark
- Subscribe
- Mute
- Subscribe to RSS Feed
- Permalink
- Report Inappropriate Content
Additional information... The JLinkDebugger (osx version) flashes and debugs the ELF files generated with no problems at all!
i.e. the "bad" builds (which stubbornly won't boot without faulting within KDS) work 100% of the time via the JLinkDebugger.
In the KDS Debug settings I tried pointing it to the new/standalone JLink executable... i.e. Executable: /Applications/SEGGER/JLink/JLinkGDBServer
No change! So does this suggest an issue with the JLink implementation inside the KDS/ Eclipse?
- Mark as New
- Bookmark
- Subscribe
- Mute
- Subscribe to RSS Feed
- Permalink
- Report Inappropriate Content
I'd recommend working the issue more directly rather than adding/removing the NOPs. Even if the NOPs "solved" the problem there would still be something going on that you do not understand and you really shouldn't move forward anyway as it will very likely bite you again.
You did the right thing by finding a repeatable error. Work that error until you understand exactly why it is failing.
It looks like are getting a usage hard fault. The next step is to figure out why. The conditions for a Cortex-M4 can be read about here. When you click on the "signal handler" line of your stack what is it trying to do (I suspect an illegal instruction) then click on the ADC1_init() line of your stack and figure out how it got there. Look for bad pointers and stack overflows.
Once you sort all this out it almost always makes sense why things were acting so strangely.


