- NXP Forums
- Product Forums
- General Purpose MicrocontrollersGeneral Purpose Microcontrollers
- i.MX Forumsi.MX Forums
- QorIQ Processing PlatformsQorIQ Processing Platforms
- Identification and SecurityIdentification and Security
- Power ManagementPower Management
- MCX Microcontrollers
- S32G
- S32K
- S32V
- MPC5xxx
- Other NXP Products
- Wireless Connectivity
- S12 / MagniV Microcontrollers
- Powertrain and Electrification Analog Drivers
- Sensors
- Vybrid Processors
- Digital Signal Controllers
- 8-bit Microcontrollers
- ColdFire/68K Microcontrollers and Processors
- PowerQUICC Processors
- OSBDM and TBDML
-
- Solution Forums
- Software Forums
- MCUXpresso Software and ToolsMCUXpresso Software and Tools
- CodeWarriorCodeWarrior
- MQX Software SolutionsMQX Software Solutions
- Model-Based Design Toolbox (MBDT)Model-Based Design Toolbox (MBDT)
- FreeMASTER
- eIQ Machine Learning Software
- Embedded Software and Tools Clinic
- S32 SDK
- S32 Design Studio
- Vigiles
- GUI Guider
- Zephyr Project
- Voice Technology
- Application Software Packs
- Secure Provisioning SDK (SPSDK)
- Processor Expert Software
-
- Topics
- Mobile Robotics - Drones and RoversMobile Robotics - Drones and Rovers
- NXP Training ContentNXP Training Content
- University ProgramsUniversity Programs
- Rapid IoT
- NXP Designs
- SafeAssure-Community
- OSS Security & Maintenance
- Using Our Community
-
-
- Home
- :
- i.MX Forums
- :
- i.MX RT
- :
- I cannot debug with P&E multilink Universal FX into the iMXRT1020-EVK
I cannot debug with P&E multilink Universal FX into the iMXRT1020-EVK
- Subscribe to RSS Feed
- Mark Topic as New
- Mark Topic as Read
- Float this Topic for Current User
- Bookmark
- Subscribe
- Mute
- Printer Friendly Page
I cannot debug with P&E multilink Universal FX into the iMXRT1020-EVK
- Mark as New
- Bookmark
- Subscribe
- Mute
- Subscribe to RSS Feed
- Permalink
- Report Inappropriate Content
I cannot debug with P&E multilink Universal FX into the iMXRT1020-EVK
I can debug with the openSDA implemented into the board but when I want to debug with the Multilink FX the message that I obtain is the following:
Copyright 2018, P&E Microcomputer Systems Inc, All rights reserved
Device selected is NXP_iMX_IMXRT1021
HW Auto-Selected : Interface=USBMULTILINK Port=PEME39D39 ; USB1 : Multilink Universal FX Rev C (PEME39D39)
Connecting to target.
P&E Interface detected - Flash Version 10.18
Can not enter background mode.
- Mark as New
- Bookmark
- Subscribe
- Mute
- Subscribe to RSS Feed
- Permalink
- Report Inappropriate Content
Hello Gustavo,
I made some tests on my side and I was able to debug using a Multilink Universal FX Rev. B debugger. I used the newest version of MCUXpresso IDE and an SDK example. I had to remove J27 and J28 from the RT1020-EVK to debug correctly, see image below.
What IDE are you using? Are you using an example from the SDK or your own project?
Have a great day,
TIC
-------------------------------------------------------------------------------
Note:
- If this post answers your question, please click the "Mark Correct" button. Thank you!
- We are following threads for 7 weeks after the last post, later replies are ignored
Please open a new thread and refer to the closed one, if you have a related question at a later point in time.
-------------------------------------------------------------------------------
- Mark as New
- Bookmark
- Subscribe
- Mute
- Subscribe to RSS Feed
- Permalink
- Report Inappropriate Content
Hi Victor
Thanks for your feedback but it is not work for me.
Yes I use one example from the SKD the iled_blinky project and I can debug with the open SDA and with external JTAG I cannot debug, I open J27 and J28 and I try with 3 different probes P&E Multilink, P&E Multilink FX, Segger J-Link and no work any of the probe. the question is with other configuration I need to change to make it work?
- Mark as New
- Bookmark
- Subscribe
- Mute
- Subscribe to RSS Feed
- Permalink
- Report Inappropriate Content
Hi Gustavo,
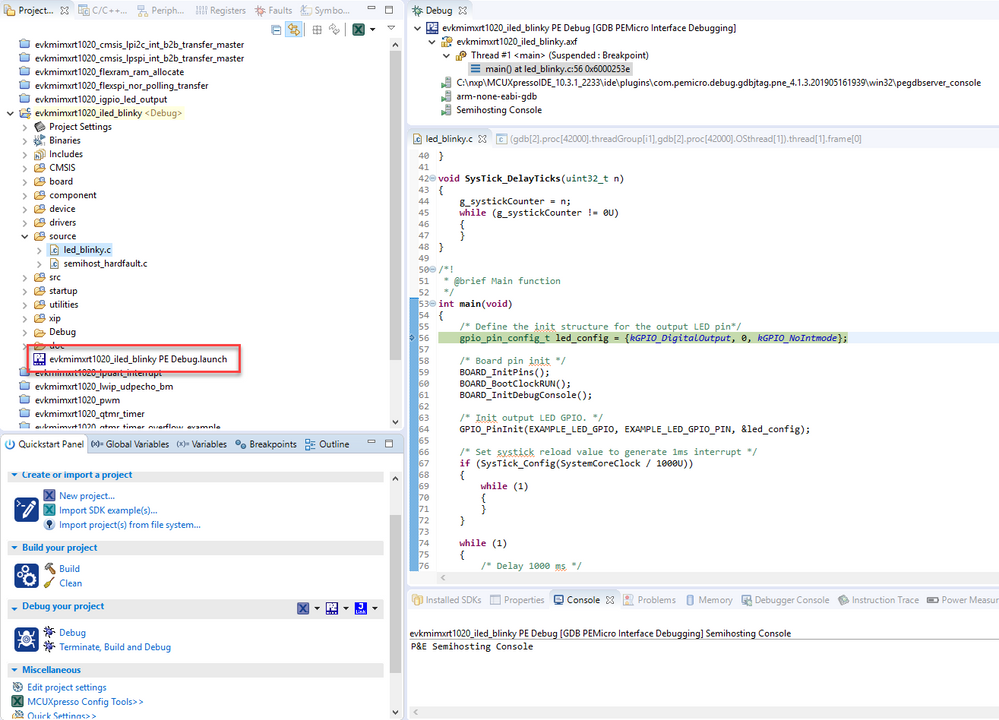
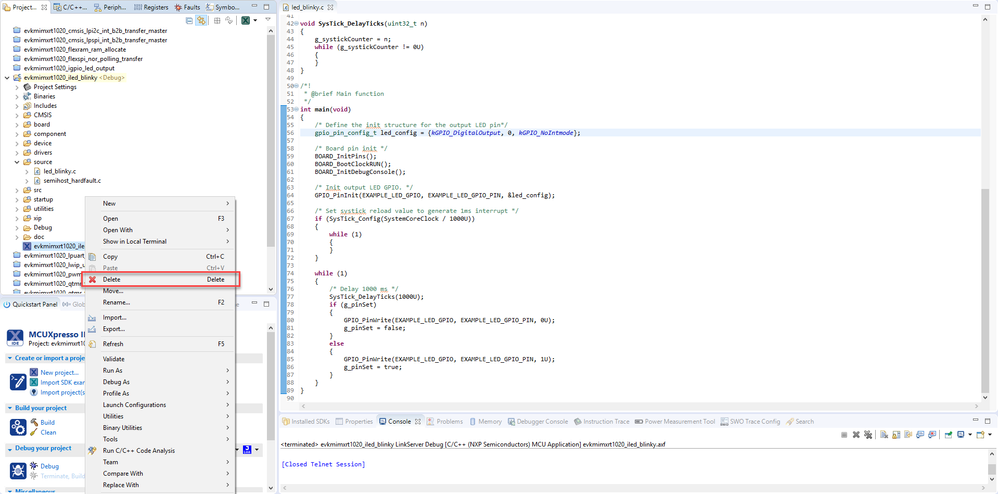
Are you connecting the debugger to J16 connector? Are you using MCUXpresso IDE? If so, when you debug with the OpenSDA and then you want to debug with another debug probe, you need to delete the debug configuration. To do this please follow the next steps:
- Select the debug configuration file.
- Right click on it.
- Delete.
Best regards,
Victor

