- NXP Forums
- Product Forums
- General Purpose MicrocontrollersGeneral Purpose Microcontrollers
- i.MX Forumsi.MX Forums
- QorIQ Processing PlatformsQorIQ Processing Platforms
- Identification and SecurityIdentification and Security
- Power ManagementPower Management
- MCX Microcontrollers
- S32G
- S32K
- S32V
- MPC5xxx
- Other NXP Products
- Wireless Connectivity
- S12 / MagniV Microcontrollers
- Powertrain and Electrification Analog Drivers
- Sensors
- Vybrid Processors
- Digital Signal Controllers
- 8-bit Microcontrollers
- ColdFire/68K Microcontrollers and Processors
- PowerQUICC Processors
- OSBDM and TBDML
-
- Solution Forums
- Software Forums
- MCUXpresso Software and ToolsMCUXpresso Software and Tools
- CodeWarriorCodeWarrior
- MQX Software SolutionsMQX Software Solutions
- Model-Based Design Toolbox (MBDT)Model-Based Design Toolbox (MBDT)
- FreeMASTER
- eIQ Machine Learning Software
- Embedded Software and Tools Clinic
- S32 SDK
- S32 Design Studio
- Vigiles
- GUI Guider
- Zephyr Project
- Voice Technology
- Application Software Packs
- Secure Provisioning SDK (SPSDK)
- Processor Expert Software
-
- Topics
- Mobile Robotics - Drones and RoversMobile Robotics - Drones and Rovers
- NXP Training ContentNXP Training Content
- University ProgramsUniversity Programs
- Rapid IoT
- NXP Designs
- SafeAssure-Community
- OSS Security & Maintenance
- Using Our Community
-
-
- Home
- :
- i.MX フォーラム
- :
- i.MX RT ナレッジベース
- :
- How to use JLINK to debug RT1170 dual core
How to use JLINK to debug RT1170 dual core
- RSS フィードを購読する
- 新着としてマーク
- 既読としてマーク
- ブックマーク
- 購読
- 印刷用ページ
- 不適切なコンテンツを報告
How to use JLINK to debug RT1170 dual core
How to use JLINK to debug RT1170 dual core
i.MXRT1170 crossover MCUs are a new generation product in the RT family of NXP. It has 1 GHz speed and rich on-chip peripherals. Among RT1170 sub-family, RT1173/RT1175/RT1176 have dual core. One cortex-M7 core runs in 1 GHz, and one cortex-M4 core runs in 400 MHz. The two cores can be debugged through one SWD port.
In MIMXRT1170-EVK,the Freelink debug interface default use CMSIS-DAP as debug probe. When debug two core project, for example the evkmimxrt1170_hello_world_cm7 project and evkmimxrt1170_hello_world_cm4 project, just click the debug button in CM7 project. After CM7 project become debug status, CM4 project start to debug automatically. But if developer want to use jlink as debug probe, he will find the CM4 project will not start automatically. If he start CM4 project debugging manually, it will fail. Can jlink debug dual core simultaneously? Yes, it can. In order to debug dual core by jlink, there are some additional settings need to be done.
- IDE and SDK
MCUXpresso IDE 11.3,
MIMXRT1170-EVK SDK 2.9.1,
Jlink probe version 9 or above or change Freelink application firmware to jlink,
Segger jlink firmware JLink_Windows_V698a.
- Import SDK example, here we select multicore_examples/evkmimxrt1170_hello_world_cm7. MCUXpresso IDE can import both CM4 and CM7 project automatically. Compile both project.
- Debug the CM7 project first. Then switch to CM4 project and also click the debug button. The CM4 project will not debug properly. So, we exit debug. With this step, the IDE created two deug configurations in RUN->Debug Configurations.
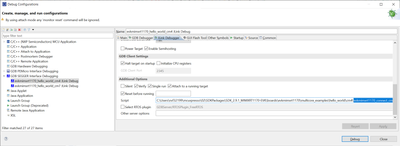
- Click the evkmimxrt1170_hello_world_cm4 JLink Debug, click JLink Debugger label, Add evkmimxrt1170_connect_cm4_cm4side.jlinkscript. Then unselect the “Attach to a running target” checkbox.

- Set a breakpoint at start of main() function of the CM4 project. This is because some time the IDE can’t suspend at start of main() when start debugging. A second breakpoint can be helpful. Take care to set the break point on BOARD_ConfigMPU() or below code. Don’t set break point on “gpio_pin_config_t led_config…”. Otherwise, debug will fail.
- Now we can start to debug CM7 project. Click the debug button in RUN-> evkmimxrt1170_hello_world_cm4 JLink Debug. This is because the IDE will enable “attach to a running target” automatically. We must disable it again.
- When CM7 debug circumstance is ready, switch to CM4 project and click “debug” button. Then resume the CM7 project. The CM4 project will start debugging and suspend at the breakpoint.
Notes:
- If you follow this guide but still can’t debug both core, please try to erase whole chip and try again.
- If CM7 project run fails in MCMGR_INIT(), please check the Boot Configure pin. It should be set to Internal Boot mode.
- 既読としてマーク
- 新着としてマーク
- ブックマーク
- ハイライト
- 印刷
- 不適切なコンテンツを報告
If someone happens to encounter any trouble following these steps, here's something that is not mentioned in the tutorial and I had to find out on my own to get my RT1160 working with J-Link debugging:
- Disable the "Enable auto-debug secondary project(s) for multicore project" checkbox in MCUXpresso IDE, “Window” → “Preferences” → “MCUXpresso IDE” → “Debug Options” → “J-Link Options”
- Follow the steps mentioned in the tutorial
- Debug the CM7 project first. After its debug instance is loaded, debug the CM4 project. Now you will be able to debug both cores simultaneously.