- NXP Forums
- Product Forums
- General Purpose MicrocontrollersGeneral Purpose Microcontrollers
- i.MX Forumsi.MX Forums
- QorIQ Processing PlatformsQorIQ Processing Platforms
- Identification and SecurityIdentification and Security
- Power ManagementPower Management
- MCX Microcontrollers
- S32G
- S32K
- S32V
- MPC5xxx
- Other NXP Products
- Wireless Connectivity
- S12 / MagniV Microcontrollers
- Powertrain and Electrification Analog Drivers
- Sensors
- Vybrid Processors
- Digital Signal Controllers
- 8-bit Microcontrollers
- ColdFire/68K Microcontrollers and Processors
- PowerQUICC Processors
- OSBDM and TBDML
-
- Solution Forums
- Software Forums
- MCUXpresso Software and ToolsMCUXpresso Software and Tools
- CodeWarriorCodeWarrior
- MQX Software SolutionsMQX Software Solutions
- Model-Based Design Toolbox (MBDT)Model-Based Design Toolbox (MBDT)
- FreeMASTER
- eIQ Machine Learning Software
- Embedded Software and Tools Clinic
- S32 SDK
- S32 Design Studio
- Vigiles
- GUI Guider
- Zephyr Project
- Voice Technology
- Application Software Packs
- Secure Provisioning SDK (SPSDK)
- Processor Expert Software
-
- Topics
- Mobile Robotics - Drones and RoversMobile Robotics - Drones and Rovers
- NXP Training ContentNXP Training Content
- University ProgramsUniversity Programs
- Rapid IoT
- NXP Designs
- SafeAssure-Community
- OSS Security & Maintenance
- Using Our Community
-
-
- Home
- :
- Product Forums
- :
- S32K
- :
- Re: Problems occurred when debugging the S32K344 using JLINK on the S32DS IDE
Problems occurred when debugging the S32K344 using JLINK on the S32DS IDE
- Subscribe to RSS Feed
- Mark Topic as New
- Mark Topic as Read
- Float this Topic for Current User
- Bookmark
- Subscribe
- Mute
- Printer Friendly Page
- Mark as New
- Bookmark
- Subscribe
- Mute
- Subscribe to RSS Feed
- Permalink
- Report Inappropriate Content
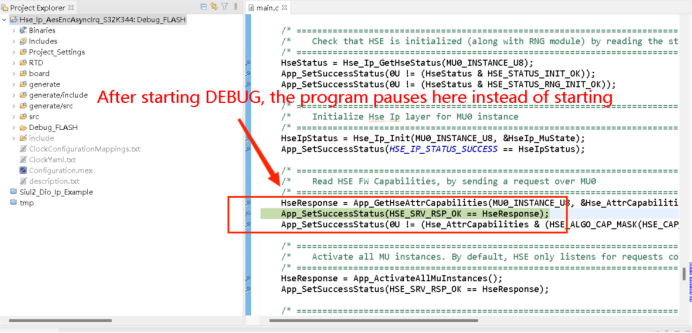
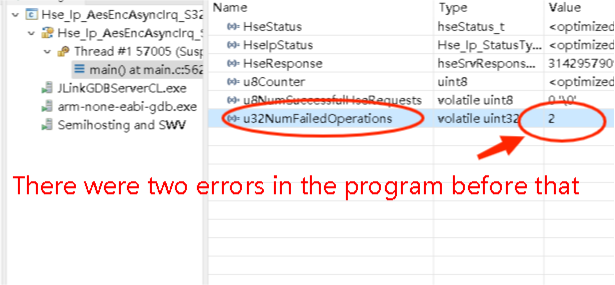
Hi everyone, I am currently learning the security startup of S32K344. Unfortunately, I did not find any relevant learning materials for my reference.So I decided to start with an project example,I found the project named Hse_Ip_AesEncAsynclrq_S32K344 in the routine and created it,but when I used the JLINK debugger to connect and DEBUG, Breakpoints are incorrectly located in the middle of the main program instead of at the beginning, and hardware interrupt errors occur irregularly during debugging.And there were also errors in the operation of the program.
Solved! Go to Solution.
- Mark as New
- Bookmark
- Subscribe
- Mute
- Subscribe to RSS Feed
- Permalink
- Report Inappropriate Content
The HSE FW and its documentation is under an NDA.
You should not be able to get it from other sources.
Yes, the demo uses Lauterbach Trace32, but it can be loaded with other debuggers.
If you need some assistance, please create a ticket instead of using this public community, because again, this is under NDA.
Thank you,
BR, Daniel
- Mark as New
- Bookmark
- Subscribe
- Mute
- Subscribe to RSS Feed
- Permalink
- Report Inappropriate Content
Hi @BrainLoader,
Is the HSE_FW installed on the MCU?
Do you have access to the S32K3 Secure files:
There are HSE DEMO, HSE reference manual and trainings.
NXP SECURE ACCESS RIGHTS FIRST-TIME USER REGISTRATION GUIDE
https://www.nxp.com/docs/en/user-guide/nxp-secure-access-rights-registration.pdf
Regards,
Daniel
- Mark as New
- Bookmark
- Subscribe
- Mute
- Subscribe to RSS Feed
- Permalink
- Report Inappropriate Content
Hi @danielmartynek ,
Thanks again for your time to reply me. I have another question.
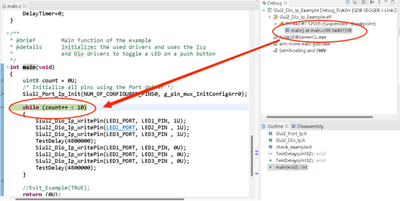
When I used the JLink debugger of SEGGER to debug my program, normally the program would stop at the entrance of main function, but when it was actually running, the program unexpectedly stopped at the middle part of main function.
I would like to know how to set the debugging to return to normal working state
The breakpoint displayed in the Debug View is in the middle of the program, not at the beginning
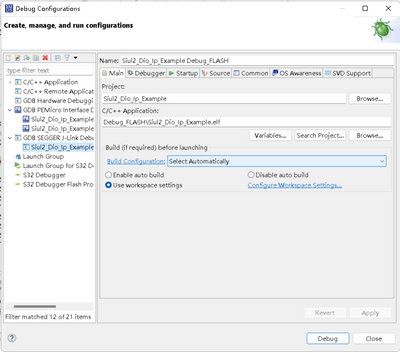
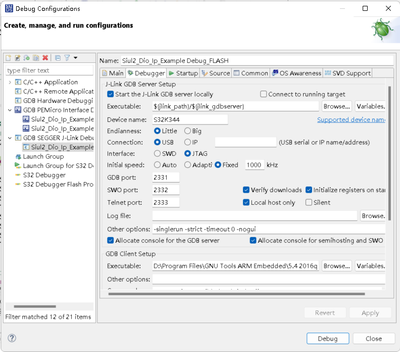
These are my debugger configurations
- Mark as New
- Bookmark
- Subscribe
- Mute
- Subscribe to RSS Feed
- Permalink
- Report Inappropriate Content
Hi @BrainLoader,
Can you please create a new thread for this last question as it is not related to the original topic of this thread?
Thank you,
BR, Daniel
- Mark as New
- Bookmark
- Subscribe
- Mute
- Subscribe to RSS Feed
- Permalink
- Report Inappropriate Content
- Mark as New
- Bookmark
- Subscribe
- Mute
- Subscribe to RSS Feed
- Permalink
- Report Inappropriate Content
The HSE FW and its documentation is under an NDA.
You should not be able to get it from other sources.
Yes, the demo uses Lauterbach Trace32, but it can be loaded with other debuggers.
If you need some assistance, please create a ticket instead of using this public community, because again, this is under NDA.
Thank you,
BR, Daniel
