- NXP Forums
- Product Forums
- General Purpose MicrocontrollersGeneral Purpose Microcontrollers
- i.MX Forumsi.MX Forums
- QorIQ Processing PlatformsQorIQ Processing Platforms
- Identification and SecurityIdentification and Security
- Power ManagementPower Management
- MCX Microcontrollers
- S32G
- S32K
- S32V
- MPC5xxx
- Other NXP Products
- Wireless Connectivity
- S12 / MagniV Microcontrollers
- Powertrain and Electrification Analog Drivers
- Sensors
- Vybrid Processors
- Digital Signal Controllers
- 8-bit Microcontrollers
- ColdFire/68K Microcontrollers and Processors
- PowerQUICC Processors
- OSBDM and TBDML
-
- Solution Forums
- Software Forums
- MCUXpresso Software and ToolsMCUXpresso Software and Tools
- CodeWarriorCodeWarrior
- MQX Software SolutionsMQX Software Solutions
- Model-Based Design Toolbox (MBDT)Model-Based Design Toolbox (MBDT)
- FreeMASTER
- eIQ Machine Learning Software
- Embedded Software and Tools Clinic
- S32 SDK
- S32 Design Studio
- Vigiles
- GUI Guider
- Zephyr Project
- Voice Technology
- Application Software Packs
- Secure Provisioning SDK (SPSDK)
- Processor Expert Software
-
- Topics
- Mobile Robotics - Drones and RoversMobile Robotics - Drones and Rovers
- NXP Training ContentNXP Training Content
- University ProgramsUniversity Programs
- Rapid IoT
- NXP Designs
- SafeAssure-Community
- OSS Security & Maintenance
- Using Our Community
-
-
- Home
- :
- ソフトウェア・フォーラム
- :
- S32 デザインスタジオ・ナレッジベース
- :
- HOWTO: debug multi-core project in S32 Design studio
HOWTO: debug multi-core project in S32 Design studio
- RSS フィードを購読する
- 新着としてマーク
- 既読としてマーク
- ブックマーク
- 購読
- 印刷用ページ
- 不適切なコンテンツを報告
HOWTO: debug multi-core project in S32 Design studio
HOWTO: debug multi-core project in S32 Design studio
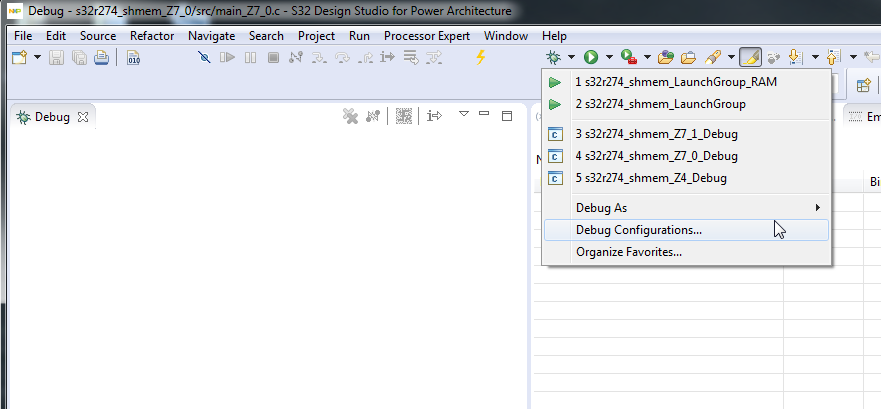
Build your project and choose Debug Configuration option
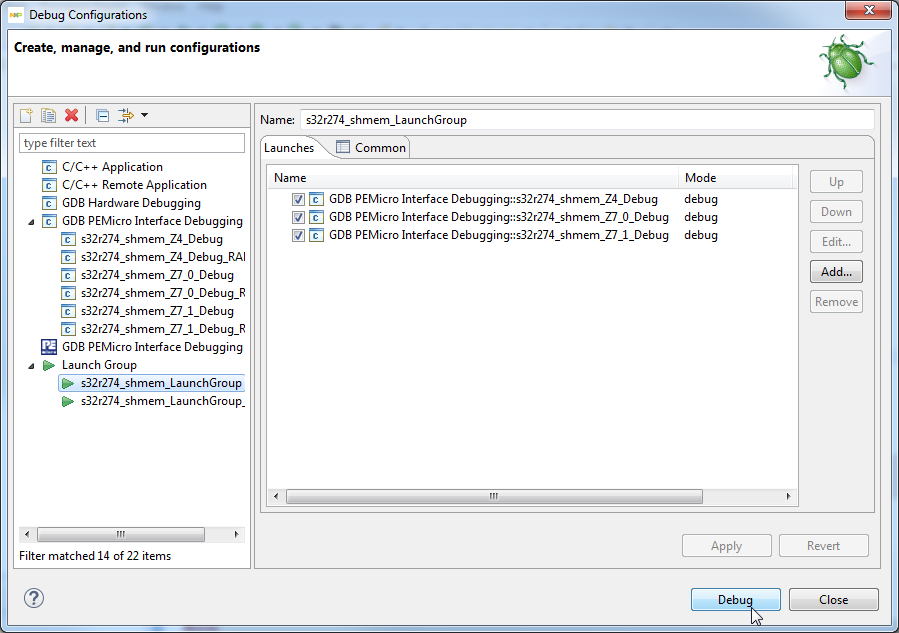
On the left side select Launch Group of your choice (Flash/RAM) and press Debug button
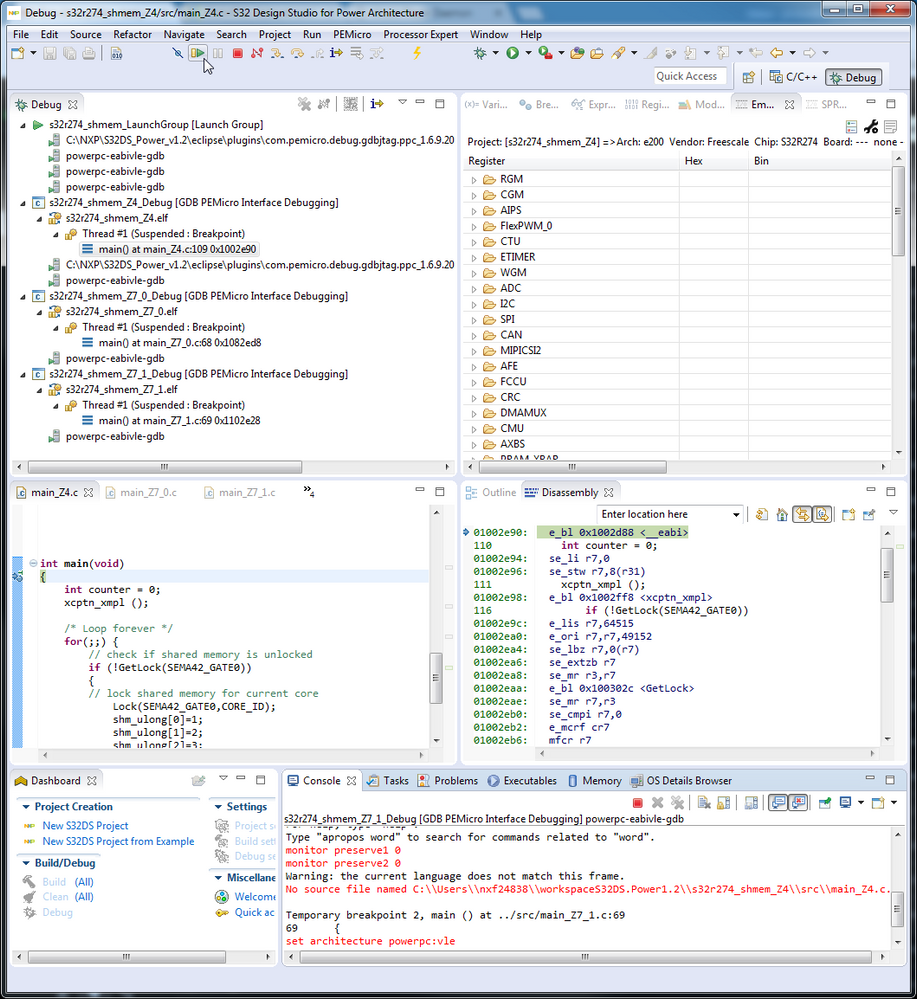
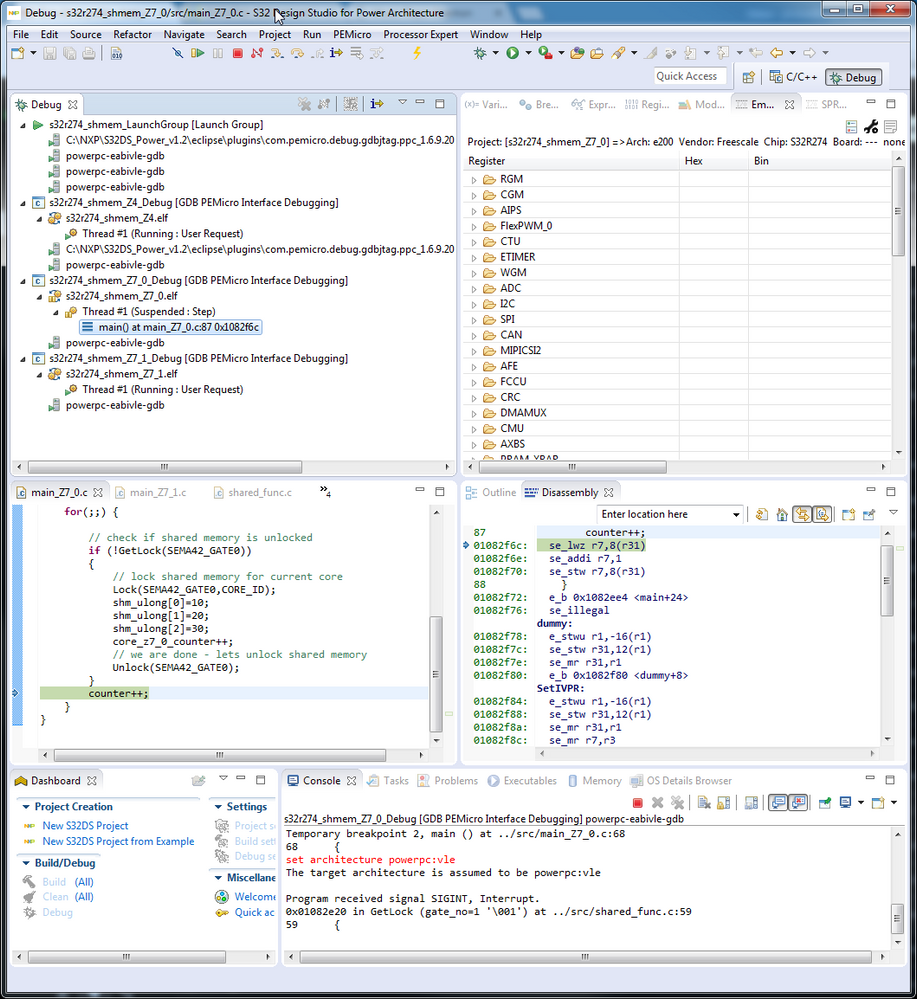
Wait while debug session is fully started. If you left default startup configuration - all cores has active break-point at the beginning of main() function. You can chose any core for debugging just by clicking on the core's thread. Sometimes are init functions - including startup of other cores - inside main() of boot core (for S32R274 is boot core Z4). In this case you should let boot core perform init sequence first and then try debug other cores. On next picture are all cores halted.
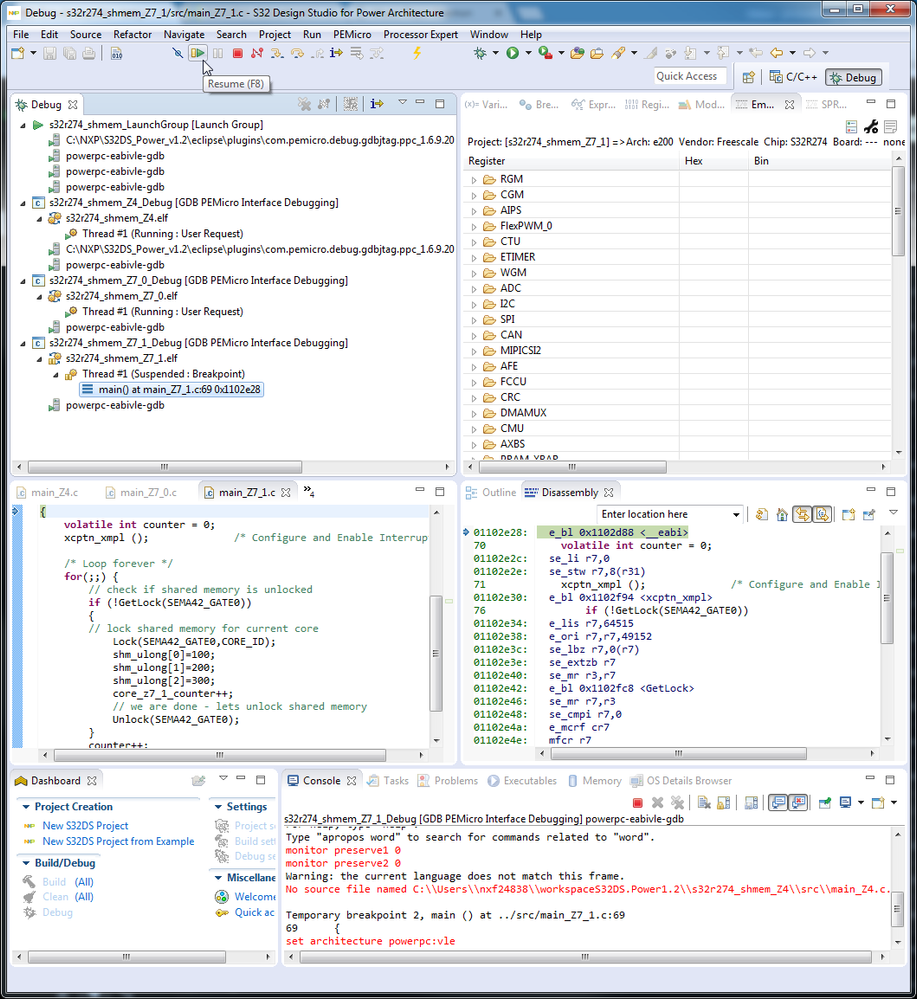
On this picture are core 1 (Z4) and 2 (Z7_0) running - and third one is stopped. You can perform any debug operation on this core (memory/registers view, instruction step...) without effect on other cores.
On the last picture are running cores 1 (Z4) and 3 (Z7_1) and second core (Z7_0) is stopped and any debug operation can be performed on this core.
- 既読としてマーク
- 新着としてマーク
- ブックマーク
- ハイライト
- 印刷
- 不適切なコンテンツを報告
Hey Jiri,
What debug configurations have you used for this sample project?
I am getting following error:
Error in services launch sequence.
PEmicro GDB Launch Failure : The GDB Server was not able to establish a connection to the target processor. Please check your connections and power. Verify that the launch settings in the Debug Configuration are accurate.
I have checked and made sure that it is not a hardware issue. I am not able to establish a connection with the target processor. I wantd to know what are the GDB run parameters that you are giving.
Thanks,
Su
