- NXP Forums
- Product Forums
- General Purpose MicrocontrollersGeneral Purpose Microcontrollers
- i.MX Forumsi.MX Forums
- QorIQ Processing PlatformsQorIQ Processing Platforms
- Identification and SecurityIdentification and Security
- Power ManagementPower Management
- MCX Microcontrollers
- S32G
- S32K
- S32V
- MPC5xxx
- Other NXP Products
- Wireless Connectivity
- S12 / MagniV Microcontrollers
- Powertrain and Electrification Analog Drivers
- Sensors
- Vybrid Processors
- Digital Signal Controllers
- 8-bit Microcontrollers
- ColdFire/68K Microcontrollers and Processors
- PowerQUICC Processors
- OSBDM and TBDML
-
- Solution Forums
- Software Forums
- MCUXpresso Software and ToolsMCUXpresso Software and Tools
- CodeWarriorCodeWarrior
- MQX Software SolutionsMQX Software Solutions
- Model-Based Design Toolbox (MBDT)Model-Based Design Toolbox (MBDT)
- FreeMASTER
- eIQ Machine Learning Software
- Embedded Software and Tools Clinic
- S32 SDK
- S32 Design Studio
- Vigiles
- GUI Guider
- Zephyr Project
- Voice Technology
- Application Software Packs
- Secure Provisioning SDK (SPSDK)
- Processor Expert Software
-
- Topics
- Mobile Robotics - Drones and RoversMobile Robotics - Drones and Rovers
- NXP Training ContentNXP Training Content
- University ProgramsUniversity Programs
- Rapid IoT
- NXP Designs
- SafeAssure-Community
- OSS Security & Maintenance
- Using Our Community
-
-
- Home
- :
- 软件论坛
- :
- S32 Design Studio知识库
- :
- HOWTO: Start S32 Debugger from S32 Design Studio on S32R45 EVB
HOWTO: Start S32 Debugger from S32 Design Studio on S32R45 EVB
HOWTO: Start S32 Debugger from S32 Design Studio on S32R45 EVB
HOWTO: Start S32 Debugger from S32 Design Studio on S32R45 EVB
The S32 Design Studio for S32 Platform supports the S32R45 device with the S32 Debugger. This document provides the details on how to setup and begin a debugging session on the S32R45 evaluation board.
Preparation
- Setup the software tools
- Install S32 Design Studio IDE
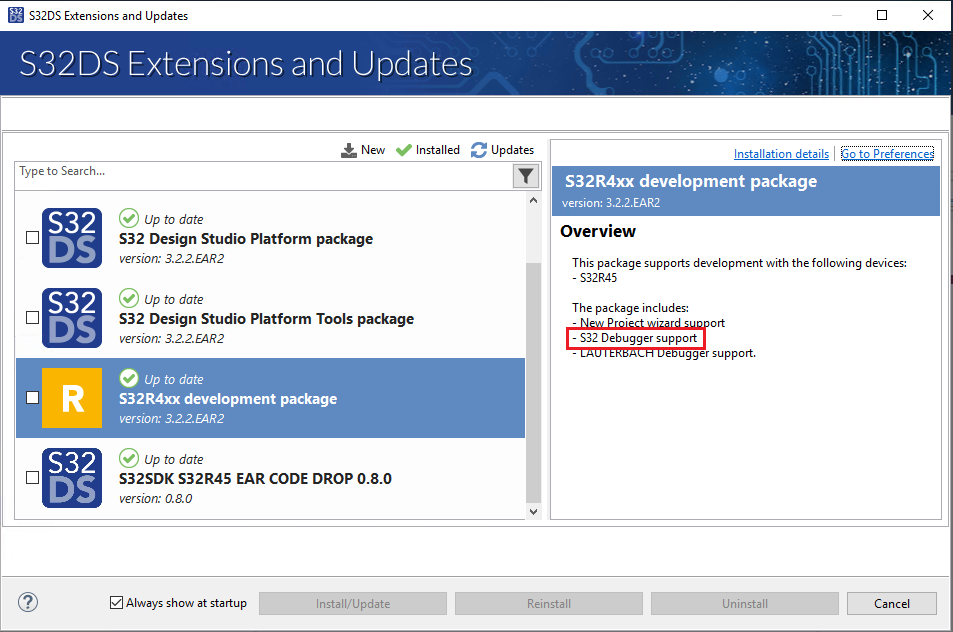
- Use the Extensions and Updates menu within S32 Design Studio for S32 Platform to add the S32R4xx Development Package.
- Setup the hardware
- Confirm the setup of the S32R45 evaluation board.
- Configure the JTAG. The S32R45 evaluation board supports both 10- and 20- pin JTAG connections. The default board configuration is set to 20-pin, change the position of the jumper J59 from 2-3(default) to 1-2, if you are using the 10 Pin JTAG interface. Both are supported by the S32 Debugger and S32 Debug Probe.
- Connect the power supply cable
- Setup the S32 Debug Probe
- Connect the S32 Debug Probe to the evaluation board via JTAG cable. Refer to the S32 Debug Probe User Manual for installation instructions. Use the JTAG connection as was confirmed in the previous step.
- Connect the S32 Debug Probe to the host PC via USB OR via Ethernet (via LAN or directly connected, and configured for static IP address) and power supply connected to USB port.
- Confirm the setup of the S32R45 evaluation board.
- Launch S32 Design Studio for S32 Platform
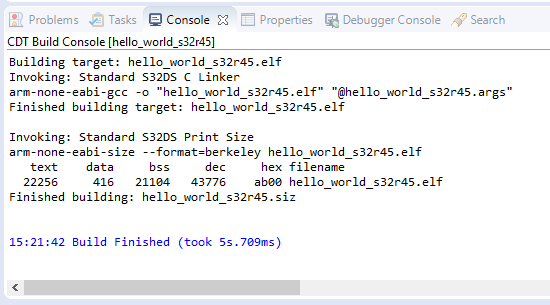
- Create new or open existing project and check that it successfully builds. If creating a new project, be sure the S32 Debugger is selected in the New Project Wizard.
Procedure
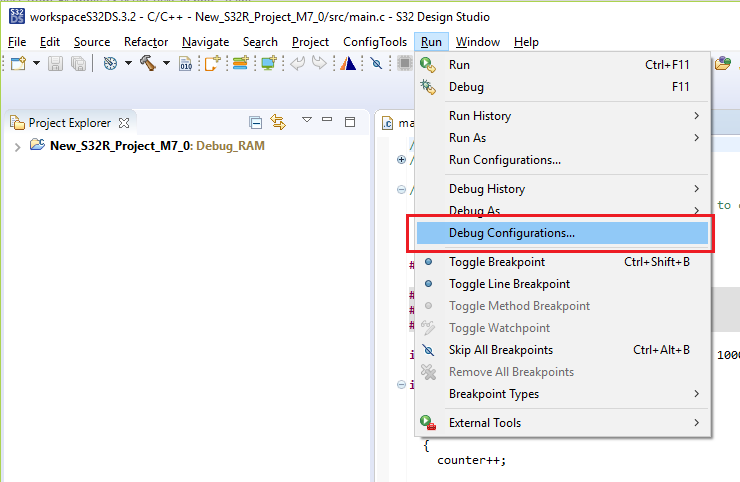
Open the Debug Configurations menu, then follow the steps depending on whether an S32 Debugger configuration exists for your project. If the project was created using the New Project Wizard in S32 Design Studio for S32 Platform, and the S32 Debugger was selected as the debugger, then it likely has existing debug configuration(s).
S32 Debugger Configuration(s) Exist
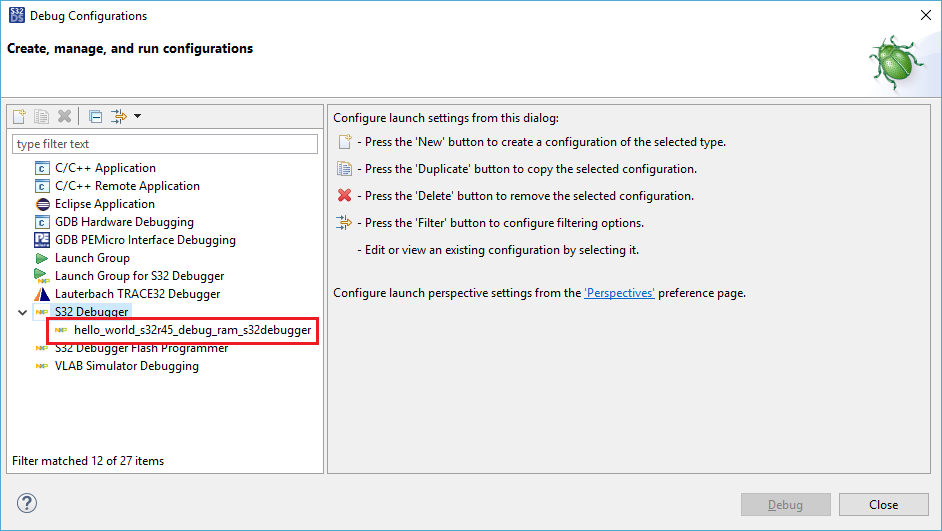
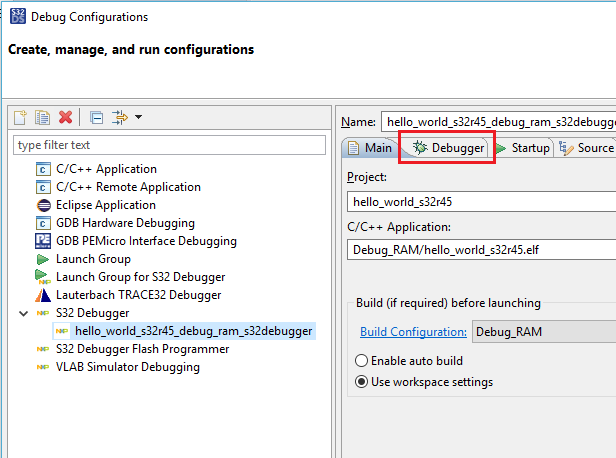
- If existing S32 Debugger configuration, proceed with probe configuration. Otherwise, skip to the next section. Below is shown the debug configuration which appears for the provided SDK example project 'hello_world_s32r45'. The suffixes 'debug', 'ram', and 's32debugger' refer to how the project was built and the debugger the configuration is for.
- Select the debug configuration which corresponds to the project, build type debug, and primary core (if a multicore project)
- Select the Debugger tab
- Select the Interface (Ethernet/USB) by which the S32 Debug Probe is connected.
- If connected via USB and this option is selected for interface, then the COM port will be detected automatically (in the rare event where 2 or more S32 Debug Probes are connected via USB to the host PC, then it may be necessary to select which COM port is correct for the probe which is connected to the EVB)
- If connected via Ethernet, enter the IP address of the probe. See the S32 Debug Probe User Manual for ways to determine the IP address.
- If connected via USB and this option is selected for interface, then the COM port will be detected automatically (in the rare event where 2 or more S32 Debug Probes are connected via USB to the host PC, then it may be necessary to select which COM port is correct for the probe which is connected to the EVB)
S32 Debugger Configuration(s) Do Not Exist
There might be no existing debug configuration if the project is being ported from another IDE or was created to use another debugger.
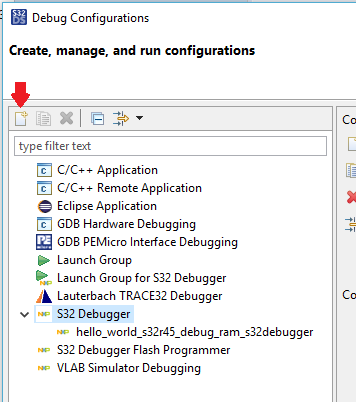
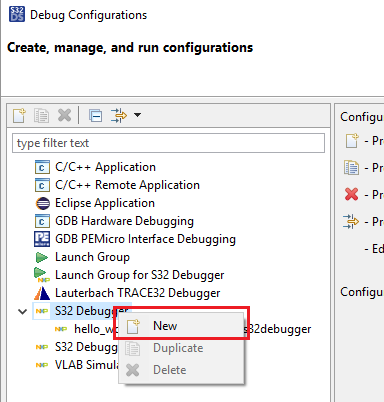
- Select the S32 Debugger heading and click New Launch configuration (or double click on the S32 Debugger heading, or right click on the S32 Debugger heading and select New from the context menu)
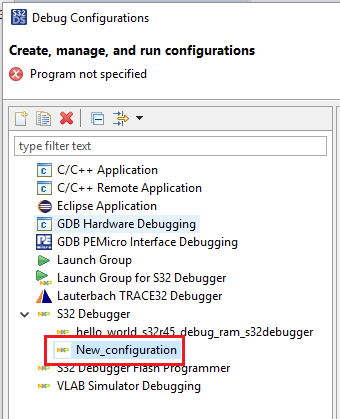
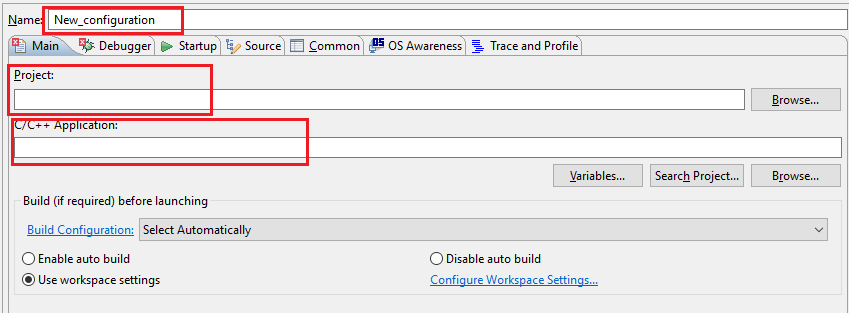
- A new debug configuration appears with the name set to the name of the active project in the Project Explorer window(this can be set by opening a file from the project or selecting an already opened file from the project in the editor), and the build type which was used to build it. If this is not matching your intended project then it can either be modified to match or deleted and recreated after the active project has been changed to the desired project. Adjust the name of the project as desired.
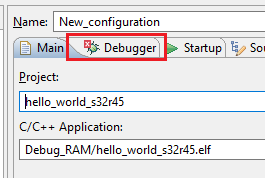
- From the Main tab, check that the Project field is set to the correct project name, as listed in the Project Explorer, and that the C/C++ Application is set to the ELF file which was built. The name of the project can be customized, but '_' must be used instead of spaces.
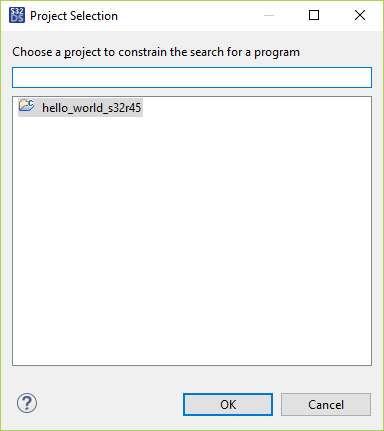
- If the Project field is not set or incorrect, click Browse... and then select the correct project name from the list. If more than one project is open in the workspace, then each will be listed. This shows how, regardless of which project is active in the C/C++ perspective, any available workspace project could be associated. This can be useful when reusing a debug configuration from one project in another.
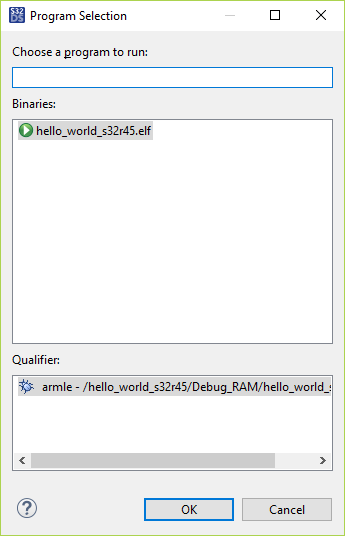
- If the C/C++ Application is not set or incorrect, click Search Project... and then select the correct binary file (will only work if Project field is correct and project was successfully built).
- If the Project field is not set or incorrect, click Browse... and then select the correct project name from the list. If more than one project is open in the workspace, then each will be listed. This shows how, regardless of which project is active in the C/C++ perspective, any available workspace project could be associated. This can be useful when reusing a debug configuration from one project in another.
- Switch to the Debugger tab,
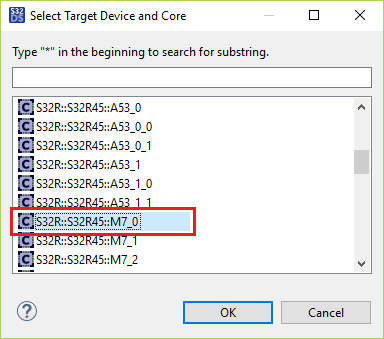
- Click 'Select device and core' and then select the correct core from the list.
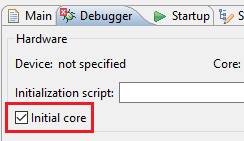
In this case, the M7_0 core is correct. - If this is not the primary core, then uncheck the box next to 'Initial core'. This is done only for multi-core projects for the non-boot cores. This causes the scripts to skip the initialization of the core as the boot core will launch the other cores so additional initialization will not be required.
- Select the Interface (Ethernet/USB) by which the S32 Debug Probe is connected.
- If connected via USB and this option is selected for interface, then the COM port will be detected automatically (in the rare event where 2 or more S32 Debug Probes are connected to the host PC, then it may be necessary to select which COM port is correct for the probe which is connected to the EVB)
- If connected via Ethernet, enter the IP address of the probe. See the S32 Debug Probe User Manual for ways to determine the IP address.
- If connected via USB and this option is selected for interface, then the COM port will be detected automatically (in the rare event where 2 or more S32 Debug Probes are connected to the host PC, then it may be necessary to select which COM port is correct for the probe which is connected to the EVB)
- Click 'Select device and core' and then select the correct core from the list.
- Click Apply
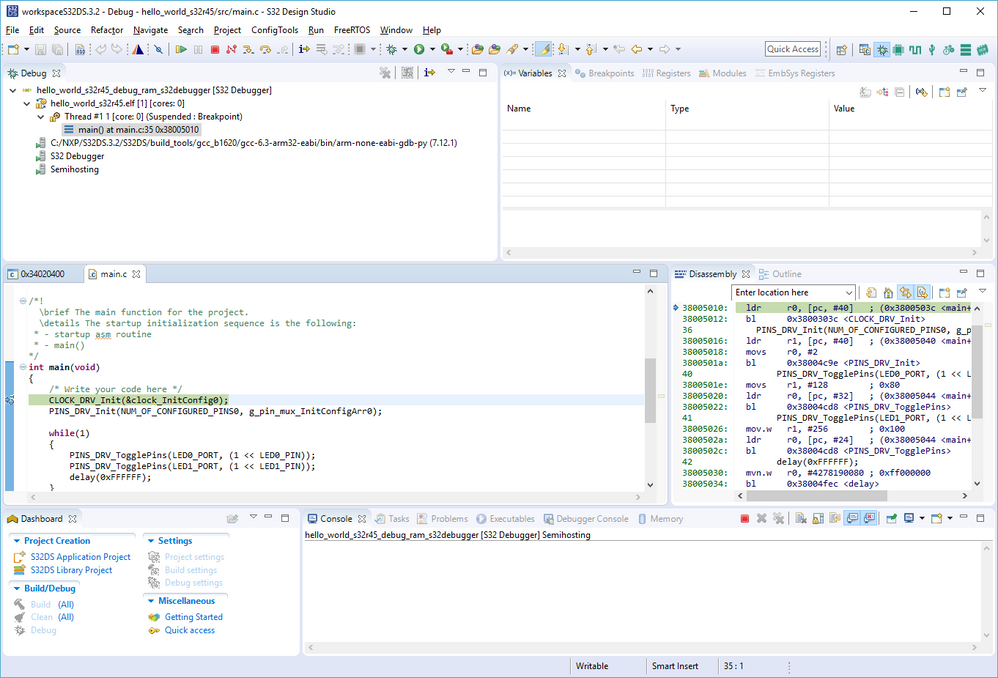
- Click Debug. This will launch the S32 Debugger. When the debugger has been successfully started, the Debug perspective is opened and the application is executed until a breakpoint is reached on the first line in main().
