- NXP Forums
- Product Forums
- General Purpose MicrocontrollersGeneral Purpose Microcontrollers
- i.MX Forumsi.MX Forums
- QorIQ Processing PlatformsQorIQ Processing Platforms
- Identification and SecurityIdentification and Security
- Power ManagementPower Management
- MCX Microcontrollers
- S32G
- S32K
- S32V
- MPC5xxx
- Other NXP Products
- Wireless Connectivity
- S12 / MagniV Microcontrollers
- Powertrain and Electrification Analog Drivers
- Sensors
- Vybrid Processors
- Digital Signal Controllers
- 8-bit Microcontrollers
- ColdFire/68K Microcontrollers and Processors
- PowerQUICC Processors
- OSBDM and TBDML
-
- Solution Forums
- Software Forums
- MCUXpresso Software and ToolsMCUXpresso Software and Tools
- CodeWarriorCodeWarrior
- MQX Software SolutionsMQX Software Solutions
- Model-Based Design Toolbox (MBDT)Model-Based Design Toolbox (MBDT)
- FreeMASTER
- eIQ Machine Learning Software
- Embedded Software and Tools Clinic
- S32 SDK
- S32 Design Studio
- Vigiles
- GUI Guider
- Zephyr Project
- Voice Technology
- Application Software Packs
- Secure Provisioning SDK (SPSDK)
- Processor Expert Software
-
- Topics
- Mobile Robotics - Drones and RoversMobile Robotics - Drones and Rovers
- NXP Training ContentNXP Training Content
- University ProgramsUniversity Programs
- Rapid IoT
- NXP Designs
- SafeAssure-Community
- OSS Security & Maintenance
- Using Our Community
-
-
- Home
- :
- 软件论坛
- :
- S32 Design Studio知识库
- :
- HOWTO: Start Debug on an APEX2 Application Project with S32 Debugger and S32 Debug Probe
HOWTO: Start Debug on an APEX2 Application Project with S32 Debugger and S32 Debug Probe
HOWTO: Start Debug on an APEX2 Application Project with S32 Debugger and S32 Debug Probe
HOWTO: Start Debug on an APEX2 Application Project with S32 Debugger and S32 Debug Probe
1) Prepare the evaluation board hardware
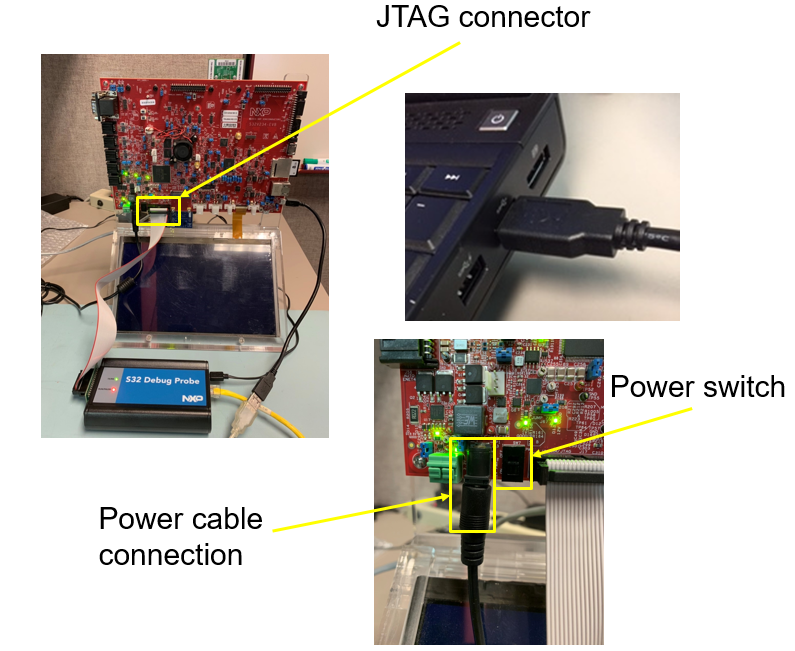
- You can use the S32 Debug Probe to download code to target
- Connect S32 Debug Probe to S32V234 EVB using JTAG connector
- Connect S32 Debug Probe to PC via USB cable OR ethernet (if connected via ethernet, then USB power cable must also be connected)
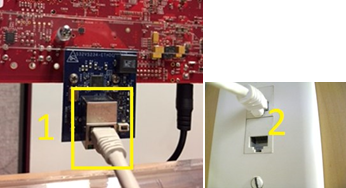
- Connect the S32V234 EVB to PC via ethernet (typically via LAN)
- Connect power cable to evaluation board and switch on the power
2) Build the project using the TEST_A53 build option.
3) Start debug on A53 core. Project is now built, ELF file is read to be loaded to EVB for execution.
4) Before a debug session can be started, we must complete HOWTO: Setup A Remote Linux Connection in S32DS for Vision.
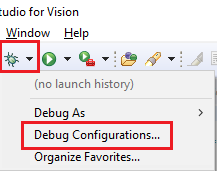
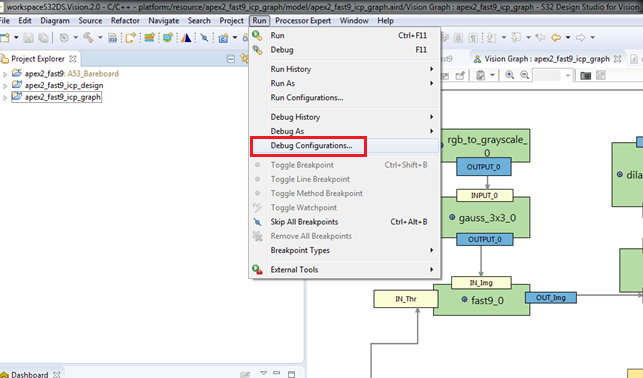
5) Select the debug drop-down menu and click Debug Configurations
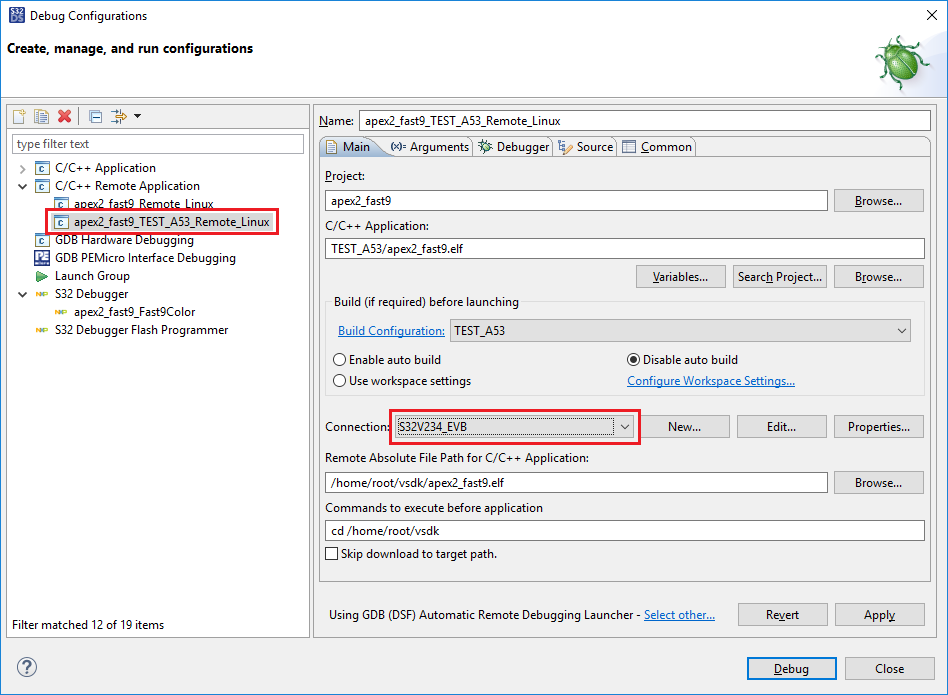
6) Make sure the Debug_Remote_Linux debug configuration is selected and the connection setup in step 4 is selected (points to the IP address of your EVB). Click Debug
7) The first time you connect to a new IP address (i.e. the first time you debug after booting the board), you will receive a warning message, Click Yes and proceed.
The executable file is copied to Linux file system and gdbserver starts.
You may get an error message on the first try, this is normal. Just try it again and it will work.
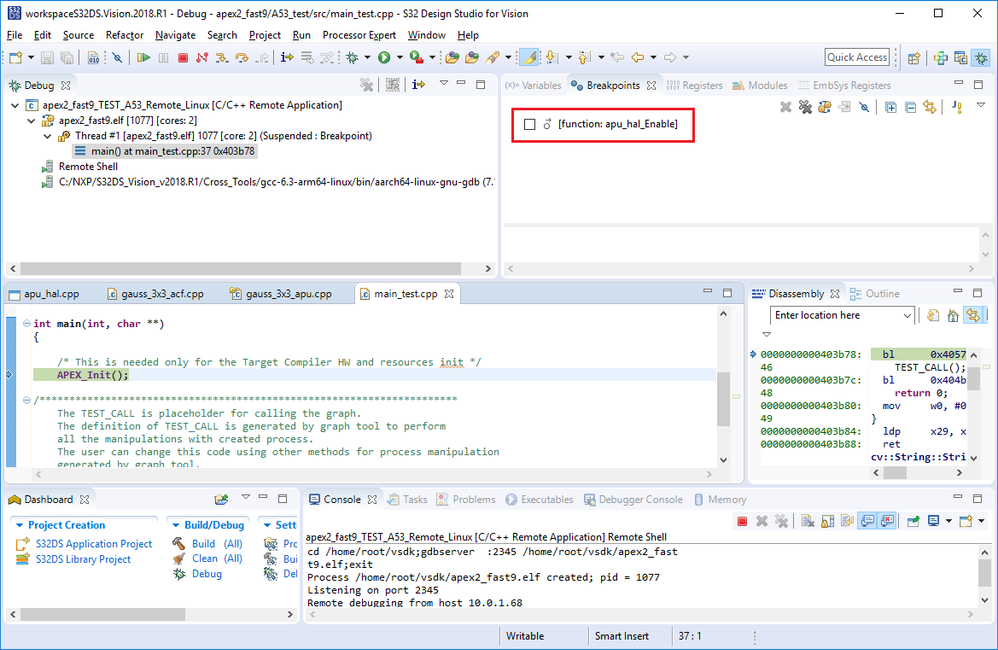
8) Once the Linux GDB has started on A53 core and the initial breakpoint is reached in main(), we need to set a breakpoint at the function apu_hal_Enable().
This breakpoint has already been created for you, you just need to enable it! Locate the breakpoint in the Breakpoints view.
Due to some known issues with Eclipse CDT, it is necessary to enable->disable->enable the breakpoint so it will work properly. The issue only affects this breakpoint, due to the way it is provided, and will not affect breakpoints which you set.
9) Press Resume twice, so that the breakpoint which was set at apu_hal_enable() is reached for the 2nd time.
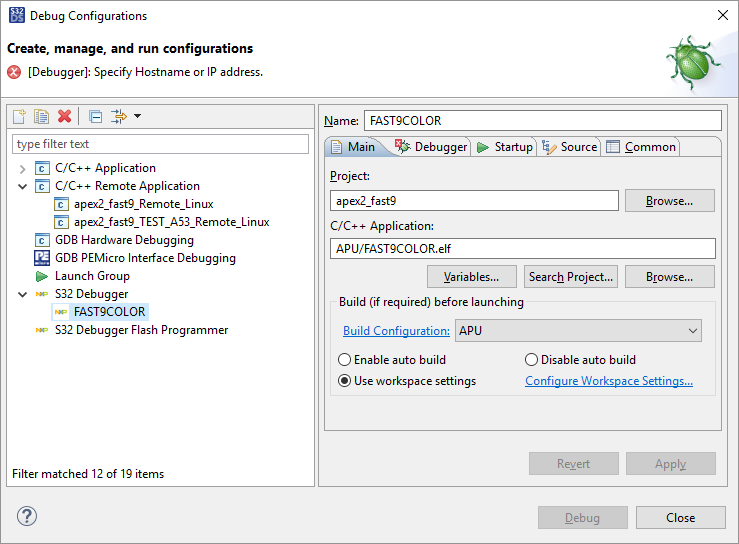
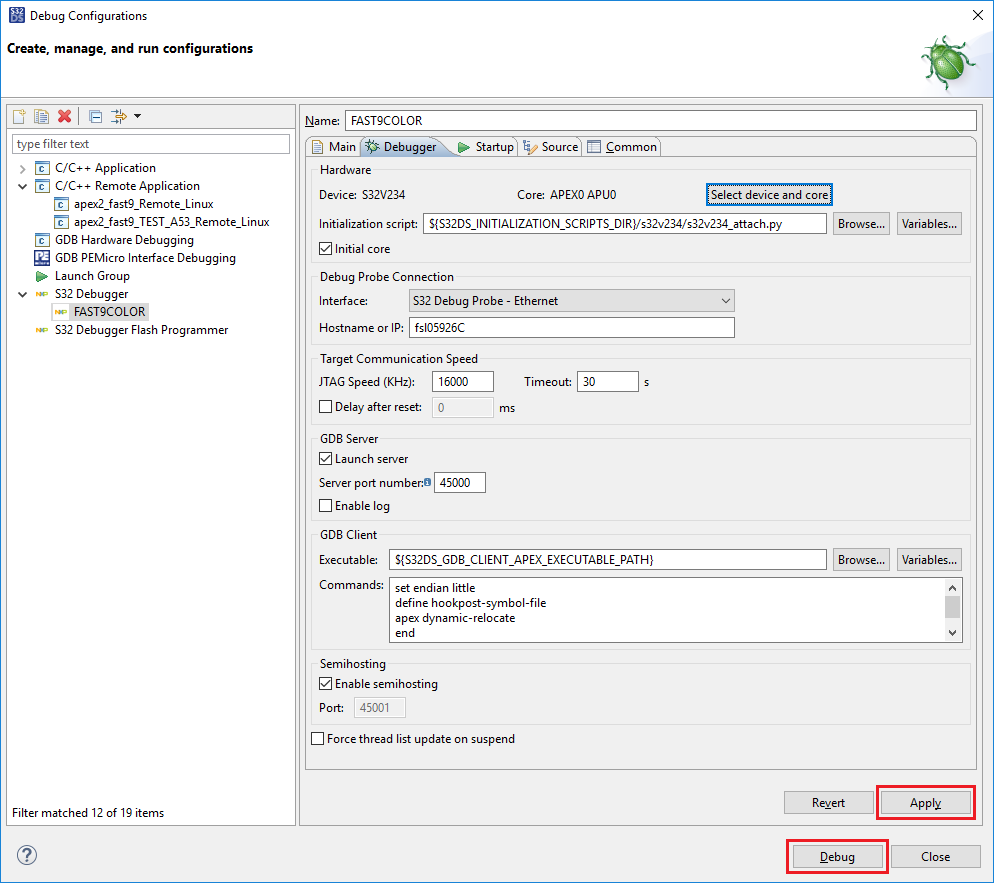
10) Open Debug Configurations. You will see a debug configuration within the 'S32 Debugger' group (FAST9COLOR as shown below). This is the debug configuration we will use, however, it will require some setup.
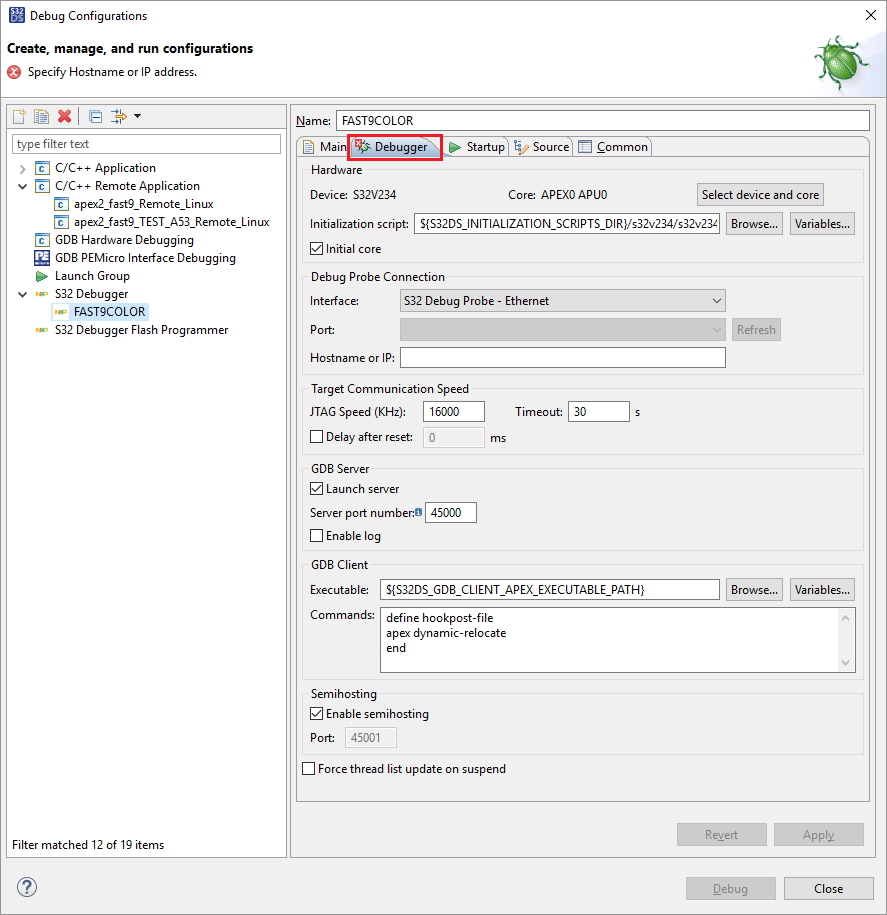
11) You should notice the error message at the top of the window, just below the title and a red 'X' on the Debugger tab. Click on the Debugger tab to select it. We must setup the Debug Probe Connection before we can proceed.
There are two options:
- Ethernet
- USB
If connecting the Probe via Ethernet, please refer to the Quick Start Guide or S32 Debug Probe User Guide provided with the S32 Debug Probe for instructions on how to connect it and determine the Hostname or IP address.
If connecting the Probe via USB, then the COM port will appear in the Port selection setting. If you have more than one S32 Debug Probe connected, you will need to determine which COM port is the correct one, otherwise, only the COM port for your S32 Debug Probe will appear.
12) Click Apply then Debug. It may take a few moments for the APEX core debug to launch.
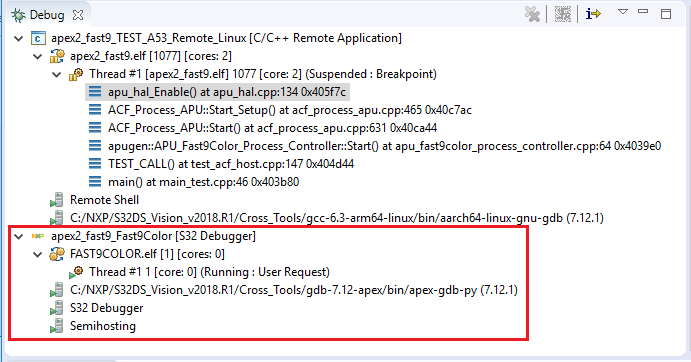
13) It may take a moment or two before the APEX2 debug thread launch is complete, see the Thread listed within the <kernel_name>[S32 Debugger] in the Debug window.
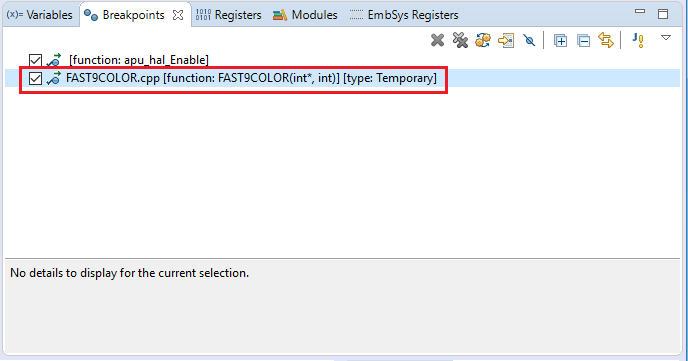
Also note, a new breakpoint is listed in the Breakpoints view. This breakpoint is set for you at the start of the APEX2 graph function.
14) The debugger context is still on the A53 thread. Press RESUME and then select the APEX2 thread to see that it has stopped on the graph function break point. Now you can step through the graph.
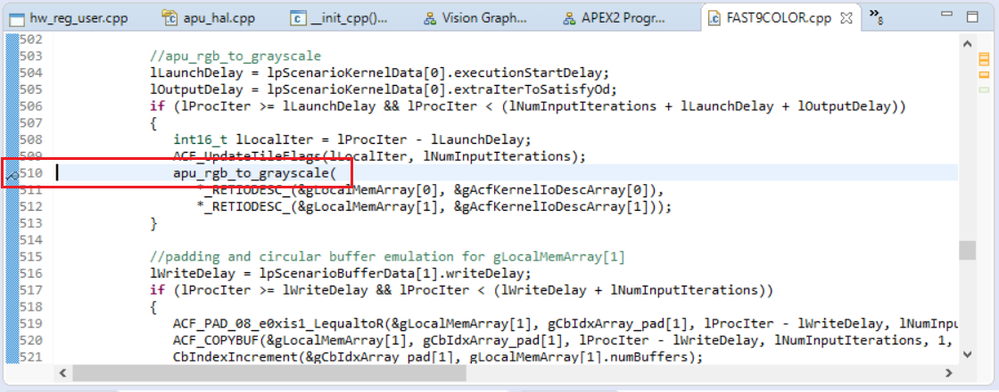
15) To step through a kernel, locate the call to the kernel function in the graph function and set a break point on the line.
16) Press RESUME to advance the program counter to the new break point
17) Press STEP INTO to advance the program counter into the kernel. It may take several steps as the optimizations performed by the compiler produce some synchronization inconsistencies.
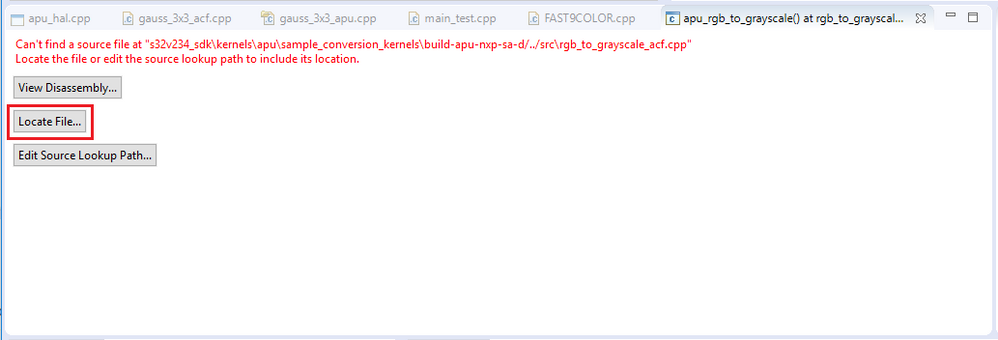
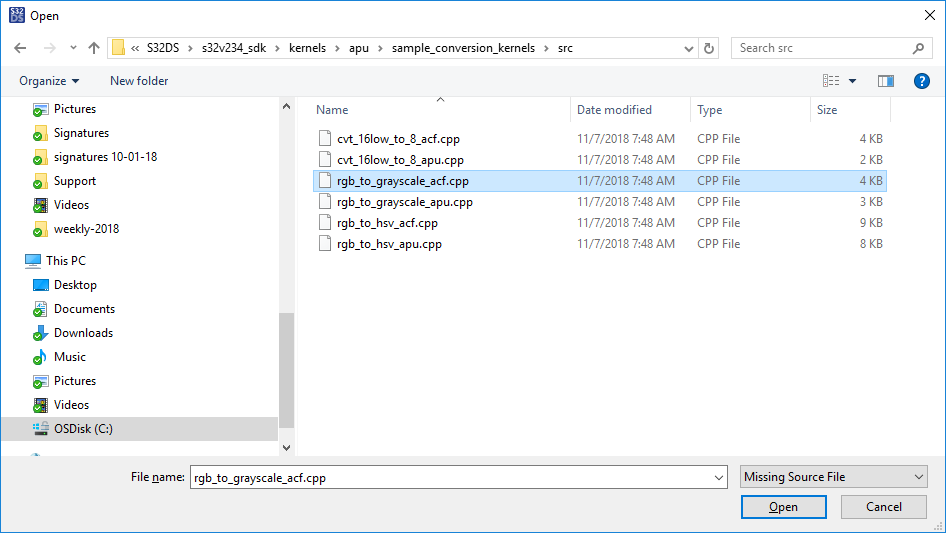
18) You may need to help the IDE to locate the source files.
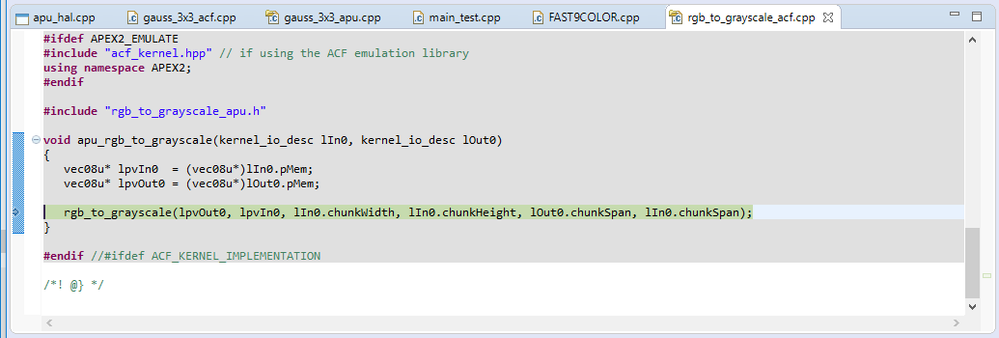
Now you can see the kernel wrapper function...
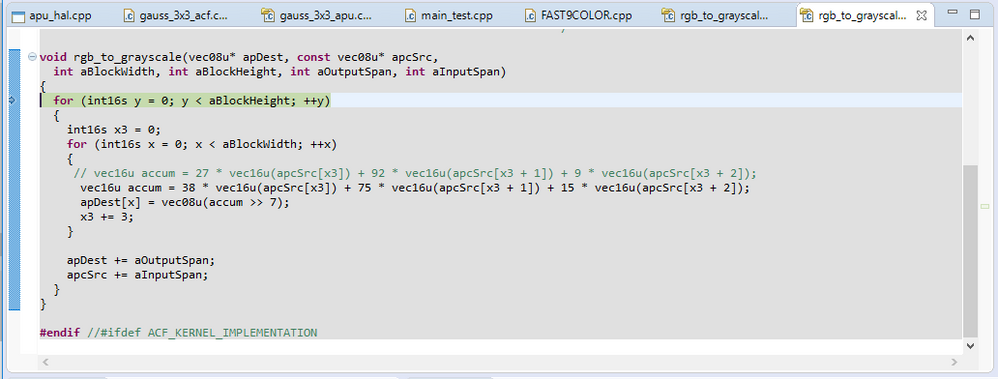
and the kernel!
19) Step through, monitor variables and registers and set breakpoints.
