- NXP Forums
- Product Forums
- General Purpose MicrocontrollersGeneral Purpose Microcontrollers
- i.MX Forumsi.MX Forums
- QorIQ Processing PlatformsQorIQ Processing Platforms
- Identification and SecurityIdentification and Security
- Power ManagementPower Management
- MCX Microcontrollers
- S32G
- S32K
- S32V
- MPC5xxx
- Other NXP Products
- Wireless Connectivity
- S12 / MagniV Microcontrollers
- Powertrain and Electrification Analog Drivers
- Sensors
- Vybrid Processors
- Digital Signal Controllers
- 8-bit Microcontrollers
- ColdFire/68K Microcontrollers and Processors
- PowerQUICC Processors
- OSBDM and TBDML
-
- Solution Forums
- Software Forums
- MCUXpresso Software and ToolsMCUXpresso Software and Tools
- CodeWarriorCodeWarrior
- MQX Software SolutionsMQX Software Solutions
- Model-Based Design Toolbox (MBDT)Model-Based Design Toolbox (MBDT)
- FreeMASTER
- eIQ Machine Learning Software
- Embedded Software and Tools Clinic
- S32 SDK
- S32 Design Studio
- Vigiles
- GUI Guider
- Zephyr Project
- Voice Technology
- Application Software Packs
- Secure Provisioning SDK (SPSDK)
- Processor Expert Software
-
- Topics
- Mobile Robotics - Drones and RoversMobile Robotics - Drones and Rovers
- NXP Training ContentNXP Training Content
- University ProgramsUniversity Programs
- Rapid IoT
- NXP Designs
- SafeAssure-Community
- OSS Security & Maintenance
- Using Our Community
-
-
- Home
- :
- Model-Based Design Toolbox (MBDT)
- :
- Model-Based Design Toolbox (MBDT)
- :
- Re: Application code has suddenly started running 50% slower
Application code has suddenly started running 50% slower
- Subscribe to RSS Feed
- Mark Topic as New
- Mark Topic as Read
- Float this Topic for Current User
- Bookmark
- Subscribe
- Mute
- Printer Friendly Page
Application code has suddenly started running 50% slower
- Mark as New
- Bookmark
- Subscribe
- Mute
- Subscribe to RSS Feed
- Permalink
- Report Inappropriate Content
Hi all, I have obviously been adding logic as my model progresses and I have now suddenly had it make everything 50% slower.
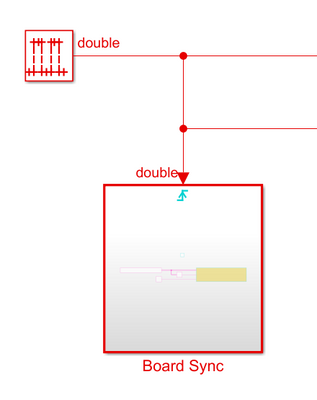
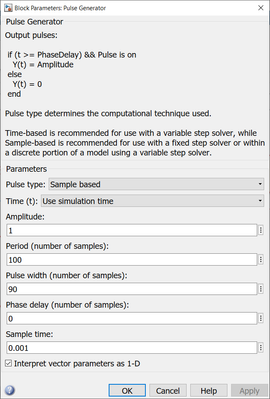
For example, this 100ms trigger has always sent the CAN transmit block inside at 100ms. It is now sending at 150ms. This is happening to the whole model now, everything is 50% slower (Even tasks with sample rate of 1s are 50% slower)
100ms trigger block:
In other uC's I've used in Simulink before I have seen issues like this when program memory is nearly full, Is there anything the reports back how much program or data memory has been used after a build like Microchip's blockset does?
I am hoping the memory isn't the issue because there is not much logic in at all yet and will be over double it's current state when finished.
Thanks in advance!
- Mark as New
- Bookmark
- Subscribe
- Mute
- Subscribe to RSS Feed
- Permalink
- Report Inappropriate Content
Hello @Poley ,
We shall investigate this with the profiler block. This block adds a header and footer code in the s-function in which it is placed and takes the counter value of a timer (20Mhz). It returns the difference in ticks between entering and exiting moments of the function.
My guess is that at some point, the task which is triggered by the model fixed-step, used to drive all the systems, takes more than the time Simulink expects. For example, if the step size is set to 50us but it takes between 50us and 100us, then it will be triggered at every 100us. (backend, the fixed-step value, sets a timer, which triggers the step function. If the interrupt occurs while the core is executing the handler, then the interrupt will continue running the handler, will clear the interrupt bit when exiting the handler. The next handler execution will be triggered when the interrupt appears again). In this particular situation, the system becomes 50% slower and this is what I guess it happens with your model.
So my suggestion is to start using the profiler block maybe there is some room for optimization.
Hope this helps,
Marius
- Mark as New
- Bookmark
- Subscribe
- Mute
- Subscribe to RSS Feed
- Permalink
- Report Inappropriate Content
Can you please have a quick look at my simplified model that still produces the fault I am seeing (CAN runs at 150ms not 100ms)?
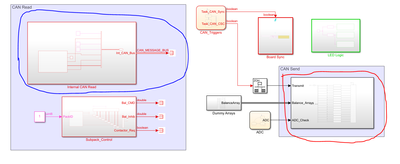
If I have one of either of these blocks commented out then it runs at the correct rate (100ms):
Is there a better way of doing what I am trying to do? The box on the left I need to receive 96 CAN messages every 100ms on CAN2 (They are staggered and not all at once) and then the right subsystem I need to transmit 16 CAN message on CAN2 every 100ms as well. In my main model I also have 8 messages being sent at 100ms on CAN0 and duplicated onto CAN1.
Will appreciate any feedback on this as it currently has me completely stuck with a short deadline, thank you!
- Mark as New
- Bookmark
- Subscribe
- Mute
- Subscribe to RSS Feed
- Permalink
- Report Inappropriate Content
Hello @Poley ,
I can't generate the code because of the following message: "The data dictionary 'VA_BMS.sldd' was not found." Can you please attach that as well?
@paulvlase , can you have a look on Poley's model?
Regards,
Marius
- Mark as New
- Bookmark
- Subscribe
- Mute
- Subscribe to RSS Feed
- Permalink
- Report Inappropriate Content
- Mark as New
- Bookmark
- Subscribe
- Mute
- Subscribe to RSS Feed
- Permalink
- Report Inappropriate Content
- Mark as New
- Bookmark
- Subscribe
- Mute
- Subscribe to RSS Feed
- Permalink
- Report Inappropriate Content
Hi @mariuslucianand @paulvlase
Is is possible to check if there is an update to looking at this please?
This CAN receive/transmit scheduling is really affecting the progress of the project now, I am hoping it is just a case of me using the blocks wrong and therefore will have an easy solution.
Thank you!
- Mark as New
- Bookmark
- Subscribe
- Mute
- Subscribe to RSS Feed
- Permalink
- Report Inappropriate Content
Thank you for the reply, how can I use the profiler block to diagnose what is causing this issue? Thanks!


