- Forums
- Product Forums
- General Purpose MicrocontrollersGeneral Purpose Microcontrollers
- i.MX Forumsi.MX Forums
- QorIQ Processing PlatformsQorIQ Processing Platforms
- Identification and SecurityIdentification and Security
- Power ManagementPower Management
- Wireless ConnectivityWireless Connectivity
- RFID / NFCRFID / NFC
- Advanced AnalogAdvanced Analog
- MCX Microcontrollers
- S32G
- S32K
- S32V
- MPC5xxx
- Other NXP Products
- S12 / MagniV Microcontrollers
- Powertrain and Electrification Analog Drivers
- Sensors
- Vybrid Processors
- Digital Signal Controllers
- 8-bit Microcontrollers
- ColdFire/68K Microcontrollers and Processors
- PowerQUICC Processors
- OSBDM and TBDML
- S32M
- S32Z/E
-
- Solution Forums
- Software Forums
- MCUXpresso Software and ToolsMCUXpresso Software and Tools
- CodeWarriorCodeWarrior
- MQX Software SolutionsMQX Software Solutions
- Model-Based Design Toolbox (MBDT)Model-Based Design Toolbox (MBDT)
- FreeMASTER
- eIQ Machine Learning Software
- Embedded Software and Tools Clinic
- S32 SDK
- S32 Design Studio
- GUI Guider
- Zephyr Project
- Voice Technology
- Application Software Packs
- Secure Provisioning SDK (SPSDK)
- Processor Expert Software
- Generative AI & LLMs
-
- Topics
- Mobile Robotics - Drones and RoversMobile Robotics - Drones and Rovers
- NXP Training ContentNXP Training Content
- University ProgramsUniversity Programs
- Rapid IoT
- NXP Designs
- SafeAssure-Community
- OSS Security & Maintenance
- Using Our Community
-
- Cloud Lab Forums
-
- Knowledge Bases
- ARM Microcontrollers
- i.MX Processors
- Identification and Security
- Model-Based Design Toolbox (MBDT)
- QorIQ Processing Platforms
- S32 Automotive Processing Platform
- Wireless Connectivity
- CodeWarrior
- MCUXpresso Suite of Software and Tools
- MQX Software Solutions
- RFID / NFC
- Advanced Analog
-
- NXP Tech Blogs
- Home
- :
- MCUXpresso软件和工具
- :
- MCUXpresso IDE
- :
- Is it possible to execute C commands in the MCUXpresso IDE console?
Is it possible to execute C commands in the MCUXpresso IDE console?
Is it possible to execute C commands in the MCUXpresso IDE console?
When debugging a program, is it possible to interactively execute C commands in the console window in MCUXpresso IDE? For example, if I want to perform math operations on variables that have been declared, can this be done in the console?
For comparison, this is possible with Python in the Spyder IDE... you can execute Python code on variables stored in the "Variable Explorer" (or similarly in MATLAB with variables from the "workspace"). Does MCUXpresso IDE have similar capabilities? If not, is this a limitation of the IDE, or of the C programming language itself?
As stated above you cannot do this as you describe.
However, you can make use of the low level debugger to perform maths operations on variables in scope during a debug session. From the console TAB, select the GDB debugger view (this is called arm-none-eabi-gdb). From here you can perform various operations on variables such as:
info locals
i = 10
j = 10

print i + j
$1 = 20
Help -> Help Contents will return information regarding the use of GDB but this is generally beyond the scope of IDE documentation and support.
Yours,
MXUXpresso Support
Hmm, this might be a stupid question, but how does one enter gdb commands interactively from the IDE? I know I've done this before - maybe in CodeWarrior - but I can't seem to get it to take now in MCUX. I've tried with P&E and LinkServer.
Under 'Debugger Console' I have [GDB PEMicro Interface Debugging] arm-non-eabi-gdb, but nothing displays there and it won't take focus. The only option is 'Terminate the launch associated to this GDB console'. Under 'Console' I have pegdbgserver_console, which takes focus and lets me enter things but doesn't respond. The FreeRTOS TAD console doesn't let me type anything. RedlinkServer responds to HELP but it's not gdb. 'gdb traces' doesn't respond to anything.
What am I doing wrong?
Scott
Hi Scott,
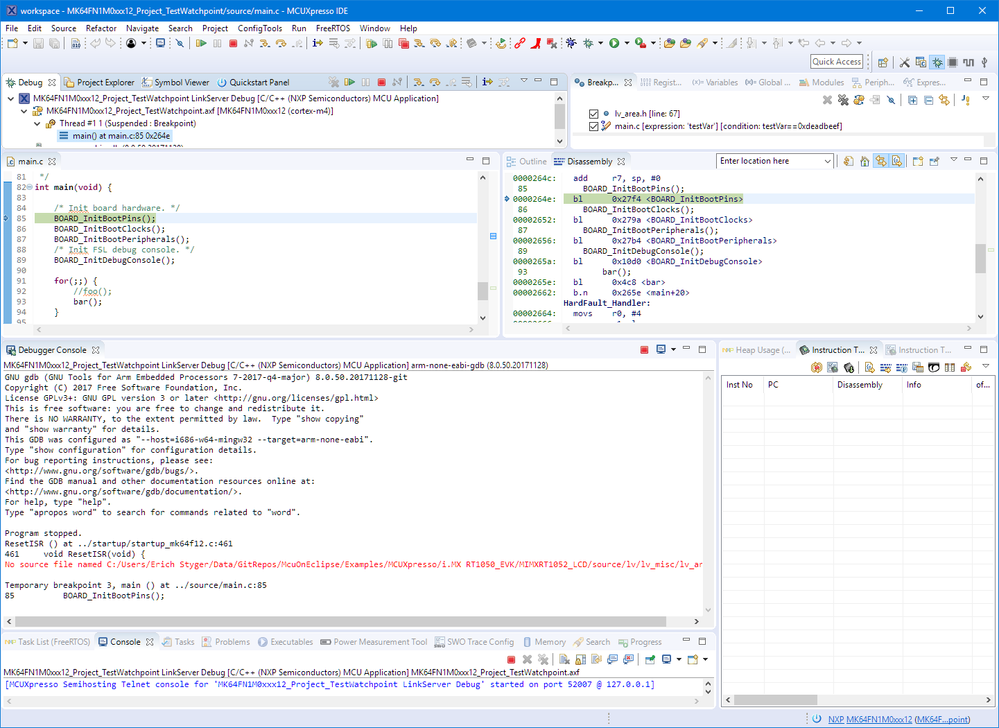
for the Debugger Console to accept commands, you have to have a gdb session running:
Erich
Hi Erich,
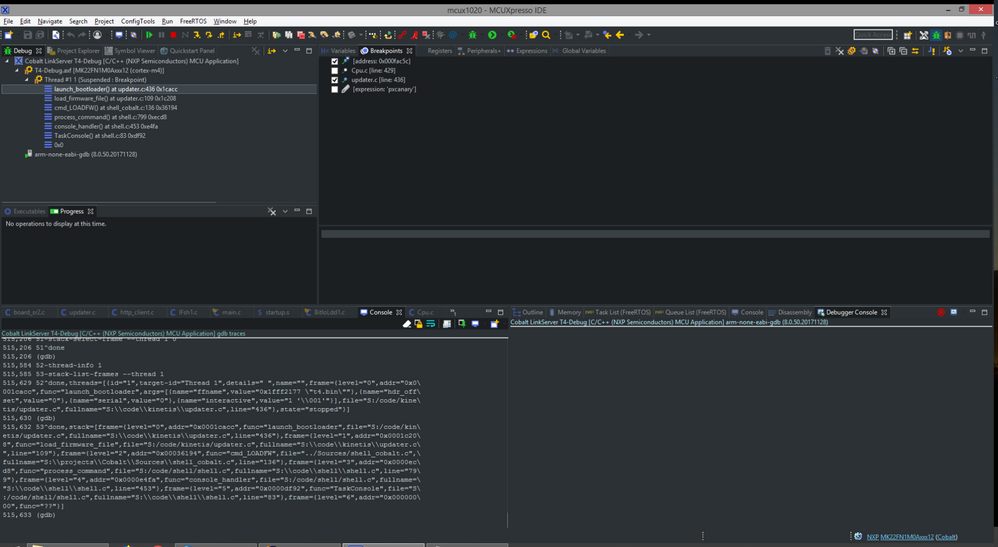
arm-none-eabi-gdb is definitely running, and it's taking 40% of the CPU time. I've also got gdb output in the console. Here's what I see:
I can enter commands on the left console, but they don't get any responses. I can't do anything with the debugger console on the right. What am I doing wrong?
I'm not having a good day so far - I'm trying to step into a function, and if I do it with F5 the target resets and the debugger loses its connection. If I turn on instruction stepping mode I can get into the function and hit F8 and *then* it will run to its breakpoint like it's supposed to. I'm even using the blue debug button, despite the fact that it takes 4x as long to launch because it makes me choose (twice!) which debug configuration to use each time, and *sometimes* it also makes me select the probe as well.
But one thing at a time. What's up with the gdb commands?
Scott
Not sure what happens on your side. But for me it writes to that console some text at startup:
Ok, I figured that part out - turns out it's the Darkest Dark theme that's breaking the debugger console! I've submitted a bug report and it sounds like Genuitec has replicated the problem.
I've gotten so used to the theme now that switching to the default hurts my eyes. I'll be sure to test any other weird issues I run into without the theme, though.
Hi Andy,
I also don't think it's possible.
Besides, for console usage, please check MCUXpresso_IDE_User_Guide.pdf under MCUXpresso IDE install folder.
sector "The Console View"
Have a great day,
Jennie Zhang
-----------------------------------------------------------------------------------------------------------------------
Note: If this post answers your question, please click the Correct Answer button. Thank you!
-----------------------------------------------------------------------------------------------------------------------


