- NXP Forums
- Product Forums
- General Purpose MicrocontrollersGeneral Purpose Microcontrollers
- i.MX Forumsi.MX Forums
- QorIQ Processing PlatformsQorIQ Processing Platforms
- Identification and SecurityIdentification and Security
- Power ManagementPower Management
- MCX Microcontrollers
- S32G
- S32K
- S32V
- MPC5xxx
- Other NXP Products
- Wireless Connectivity
- S12 / MagniV Microcontrollers
- Powertrain and Electrification Analog Drivers
- Sensors
- Vybrid Processors
- Digital Signal Controllers
- 8-bit Microcontrollers
- ColdFire/68K Microcontrollers and Processors
- PowerQUICC Processors
- OSBDM and TBDML
-
- Solution Forums
- Software Forums
- MCUXpresso Software and ToolsMCUXpresso Software and Tools
- CodeWarriorCodeWarrior
- MQX Software SolutionsMQX Software Solutions
- Model-Based Design Toolbox (MBDT)Model-Based Design Toolbox (MBDT)
- FreeMASTER
- eIQ Machine Learning Software
- Embedded Software and Tools Clinic
- S32 SDK
- S32 Design Studio
- Vigiles
- GUI Guider
- Zephyr Project
- Voice Technology
- Application Software Packs
- Secure Provisioning SDK (SPSDK)
- Processor Expert Software
-
- Topics
- Mobile Robotics - Drones and RoversMobile Robotics - Drones and Rovers
- NXP Training ContentNXP Training Content
- University ProgramsUniversity Programs
- Rapid IoT
- NXP Designs
- SafeAssure-Community
- OSS Security & Maintenance
- Using Our Community
-
-
- Home
- :
- MCUXpressoソフトウェアとツール
- :
- MCUXpresso 一般
- :
- Re: Ee(42) Could not connect to core - MCUXpresso
Ee(42) Could not connect to core - MCUXpresso
- RSS フィードを購読する
- トピックを新着としてマーク
- トピックを既読としてマーク
- このトピックを現在のユーザーにフロートします
- ブックマーク
- 購読
- ミュート
- 印刷用ページ
Ee(42) Could not connect to core - MCUXpresso
- 新着としてマーク
- ブックマーク
- 購読
- ミュート
- RSS フィードを購読する
- ハイライト
- 印刷
- 不適切なコンテンツを報告
Using MCUXpresso IDE v10.2.1 on a mac and development board OM40002 - this question is often asked but no solution for the MCUXpresso.
I have three development boards with integrated debuggers (OM40002) communicating to MCUXpresso IDE v10.2.1 [Build 795] [2018-07-25] running on a Mac.
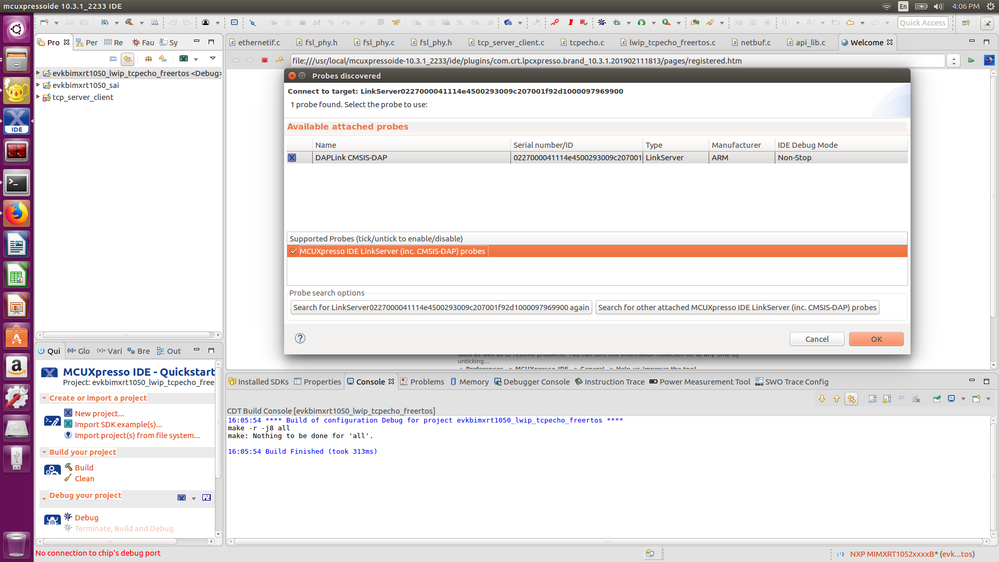
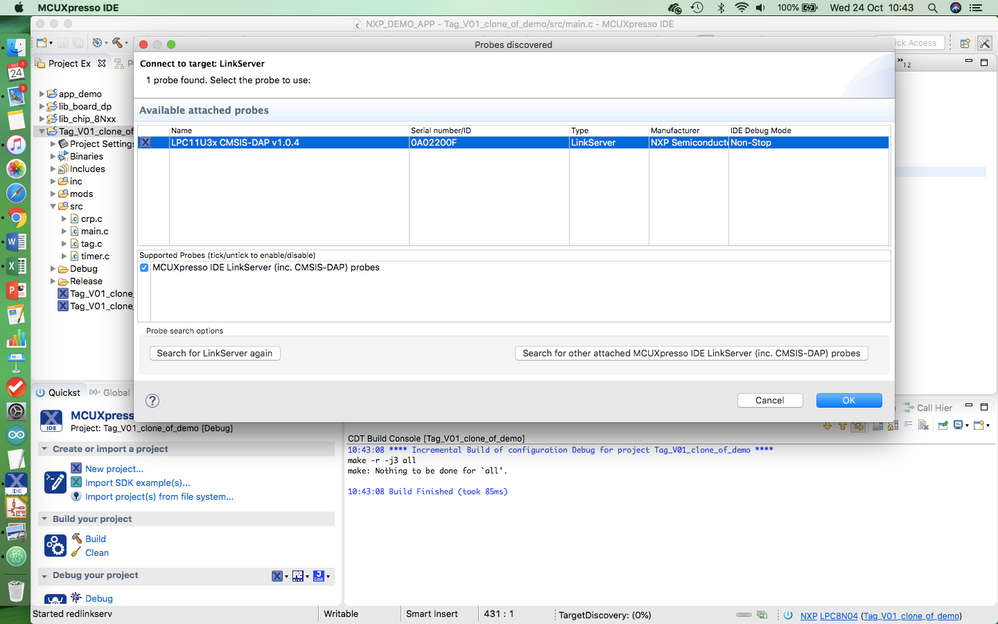
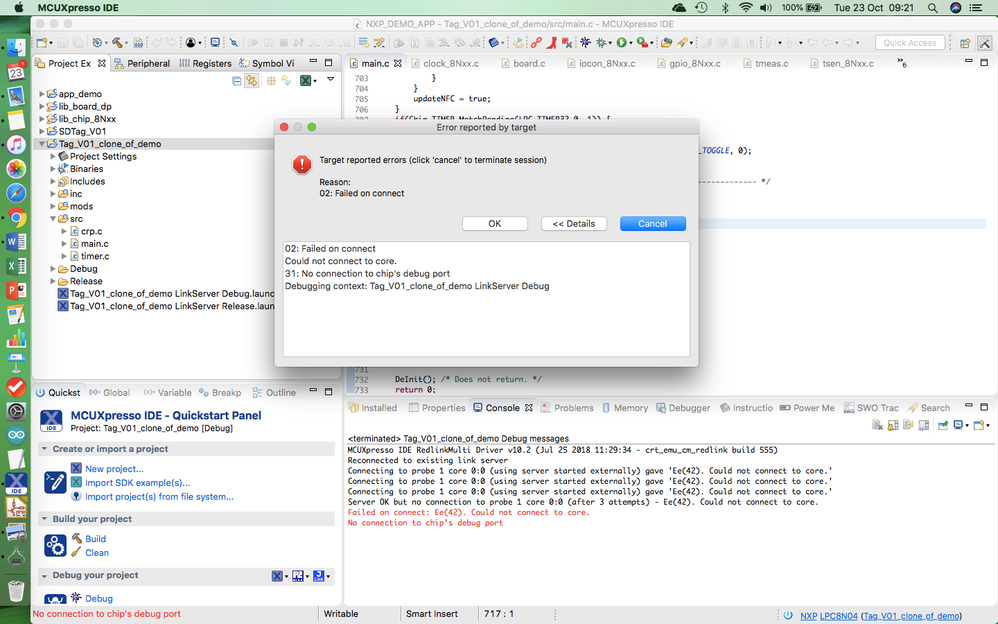
After a short while the debugger stops responding - a couple of times this has been due to me failing to stop the debugger, other times not. I have got them operating again by simply connecting another development board (OM40002) and debugging on this, then closing down and returning to the original board. But this does not always work, and im down to one operating board, so wish to find the cause/cure. Ive attached two images of the debugger info and the error.
The MCUXpresso user guide (v10.2) pages 212-217 has solutions for this. Ive tried killing the debugger by the newly added button on the GUI, Ive tried resetting the debugger via the GUI. Ive tried resetting the debugger via the script (there are two, neither found the debugger because they are looking for a different PID).
I've yet to try reflashing the debugger, partly because I don’t believe this is the problem, partly because I don’t know if the debugger on the OM40002 is Link2? There is reference to its as v1.1 and the support page below confused me further.
Question 1 - How can I re-connect the tool chain to reliably debug the LPC8N04?
Question 2 - What file/process do I perform to re-flash the debugger on the OM40002 (Not sure if its a LINK2 or LINK)?
- 新着としてマーク
- ブックマーク
- 購読
- ミュート
- RSS フィードを購読する
- ハイライト
- 印刷
- 不適切なコンテンツを報告
I also don't think this has anything to do with what processor you are using. We are using and IMXRT1052 and IMXRT1062 and see the problem on both CPU's
- 新着としてマーク
- ブックマーク
- 購読
- ミュート
- RSS フィードを購読する
- ハイライト
- 印刷
- 不適切なコンテンツを報告
I switched to the Segger J Link Base debugger and all problems are solved. What a stark difference! It is at least double the speed and actually holds the debug connection. My friend has gotten the CMSIS DAP to work on his PC, but while his flash download is reliable, it is slow and he loses connection during debugging. Then you have to reattach to the running device, which takes time and may cut out right away again.
I really pressed my FAE very hard to tell us what he used because he kept pushing these solutions that did not work, but he must have a working solution for himself. Finally, he muttered "Segger" under his breath. I knew immediately this was the truth. Always pay close attention to the mutterings of your FAE. The rest is propaganda.
I have not tried PEMicro on this IDE, but many (15) years ago it did not work well for me on another project and I hold grudges for a long time when it comes to technology.
- 新着としてマーク
- ブックマーク
- 購読
- ミュート
- RSS フィードを購読する
- ハイライト
- 印刷
- 不適切なコンテンツを報告
We have this trouble as well, but on a Windows box. We have one PC in the department that is always reliable. In other words, I can bring my board and the UNLINK2 debugger over and it will always download the firmware on my friend's PC.
Previously, on my PC, I could resolve the issue by changing the pullup on CFG 6 to boot from SD card. This would allow me to download firmware, and usually remove the disease until the problem happened again weeks later. It is an intermittent problem, but once it happens, it will always happen until you remove the disease somehow.
For awhile, simply downloading firmware on my friends computer would remove the disease, but even this is not working for us anymore. I am replacing my computer at this point. I will try a windows 10 box. My current system is windows 7 as is my friends computer.
Some other forums have related this to a Windows bug, but there is no workaround proposed or anything. I am also a bit skeptical. The claim is that the NXP disconnects USB and reconnects really fast, perhaps on nanosecond order, and the Windows drivers can't detect the event change.
I am going to replace my PC and my ULINK 2 and hopefully, I will get a combination that fixes it like my friend has.
- 新着としてマーク
- ブックマーク
- 購読
- ミュート
- RSS フィードを購読する
- ハイライト
- 印刷
- 不適切なコンテンツを報告
The application is the NFC demo supplied by NXP. There is no evidence that the SWD pins have been re-allocated.
Which pin/pins operate the ISP? There's no mention of it in the user manual UM11074
- 新着としてマーク
- ブックマーク
- 購読
- ミュート
- RSS フィードを購読する
- ハイライト
- 印刷
- 不適切なコンテンツを報告
Hello Harry,
If you are using the unmodified demo then the SWD pins are not being reallocated, the ISP pins were my mistake, this functionality is nor present in the LPC8N04. Could you give me more information about the Mac OS version that you are using?
Thanks in advance.
Best Regards,
Carlos Mendoza
Technical Support Engineer
- 新着としてマーク
- ブックマーク
- 購読
- ミュート
- RSS フィードを購読する
- ハイライト
- 印刷
- 不適切なコンテンツを報告
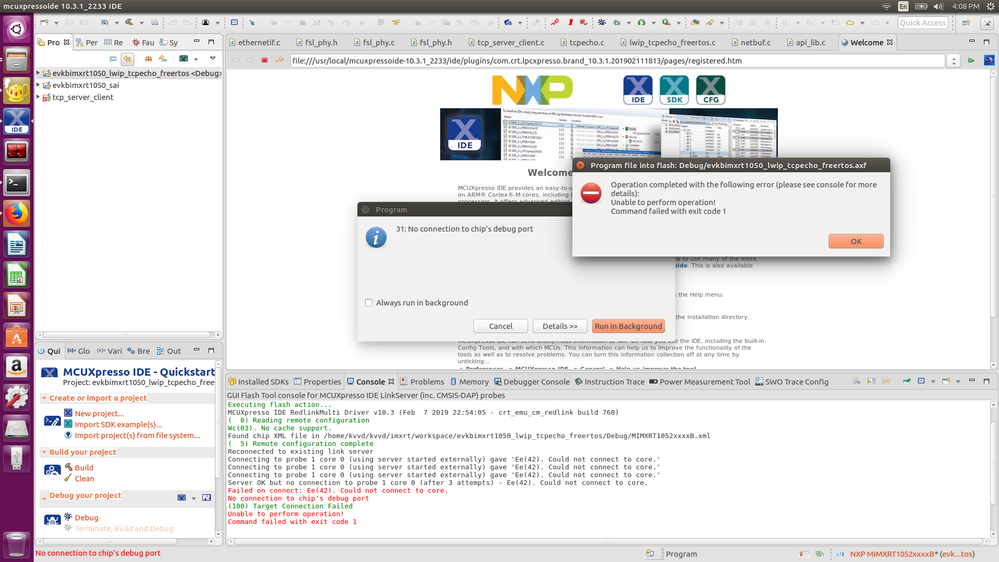
Dear Support team,
I also have the same issue.
Checking MCU info...
Scanning for targets...
Executing flash action...
MCUXpresso IDE RedlinkMulti Driver v10.3 (Feb 7 2019 22:54:05 - crt_emu_cm_redlink build 760)
( 0) Reading remote configuration
Wc(03). No cache support.
Found chip XML file in /home/kvvd/kvvd/imxrt/workspace/evkbimxrt1050_lwip_tcpecho_freertos/Debug/MIMXRT1052xxxxB.xml
( 5) Remote configuration complete
Reconnected to existing link server
Connecting to probe 1 core 0 (using server started externally) gave 'Ee(42). Could not connect to core.'
Connecting to probe 1 core 0 (using server started externally) gave 'Ee(42). Could not connect to core.'
Connecting to probe 1 core 0 (using server started externally) gave 'Ee(42). Could not connect to core.'
Server OK but no connection to probe 1 core 0 (after 3 attempts) - Ee(42). Could not connect to core.
Failed on connect: Ee(42). Could not connect to core.
No connection to chip's debug port
(100) Target Connection Failed
Unable to perform operation!
Command failed with exit code 1


- 新着としてマーク
- ブックマーク
- 購読
- ミュート
- RSS フィードを購読する
- ハイライト
- 印刷
- 不適切なコンテンツを報告
Could it be possible that I have inadvertently enabled the CRP, or corrupted the bootloader (in read only flash)? Is it possible to check either of these addresses witout having an operating debugger?
- 新着としてマーク
- ブックマーク
- 購読
- ミュート
- RSS フィードを購読する
- ハイライト
- 印刷
- 不適切なコンテンツを報告
Hello Harry,
What is your application doing? Maybe the application configured the SWD pins to another function or placed the MCU in an state not accessible by the debugger, please try placing the MCU in ISP mode and then try launching the debug session, you can find more information on this link:
Regaining debug access to target MCU
Hope it helps!
Best Regards,
Carlos Mendoza
Technical Support Engineer

