- Forums
- Product Forums
- General Purpose MicrocontrollersGeneral Purpose Microcontrollers
- i.MX Forumsi.MX Forums
- QorIQ Processing PlatformsQorIQ Processing Platforms
- Identification and SecurityIdentification and Security
- Power ManagementPower Management
- Wireless ConnectivityWireless Connectivity
- RFID / NFCRFID / NFC
- Advanced AnalogAdvanced Analog
- MCX Microcontrollers
- S32G
- S32K
- S32V
- MPC5xxx
- Other NXP Products
- S12 / MagniV Microcontrollers
- Powertrain and Electrification Analog Drivers
- Sensors
- Vybrid Processors
- Digital Signal Controllers
- 8-bit Microcontrollers
- ColdFire/68K Microcontrollers and Processors
- PowerQUICC Processors
- OSBDM and TBDML
- S32M
- S32Z/E
-
- Solution Forums
- Software Forums
- MCUXpresso Software and ToolsMCUXpresso Software and Tools
- CodeWarriorCodeWarrior
- MQX Software SolutionsMQX Software Solutions
- Model-Based Design Toolbox (MBDT)Model-Based Design Toolbox (MBDT)
- FreeMASTER
- eIQ Machine Learning Software
- Embedded Software and Tools Clinic
- S32 SDK
- S32 Design Studio
- GUI Guider
- Zephyr Project
- Voice Technology
- Application Software Packs
- Secure Provisioning SDK (SPSDK)
- Processor Expert Software
- Generative AI & LLMs
-
- Topics
- Mobile Robotics - Drones and RoversMobile Robotics - Drones and Rovers
- NXP Training ContentNXP Training Content
- University ProgramsUniversity Programs
- Rapid IoT
- NXP Designs
- SafeAssure-Community
- OSS Security & Maintenance
- Using Our Community
-
- Cloud Lab Forums
-
- Knowledge Bases
- ARM Microcontrollers
- i.MX Processors
- Identification and Security
- Model-Based Design Toolbox (MBDT)
- QorIQ Processing Platforms
- S32 Automotive Processing Platform
- Wireless Connectivity
- CodeWarrior
- MCUXpresso Suite of Software and Tools
- MQX Software Solutions
- RFID / NFC
- Advanced Analog
-
- NXP Tech Blogs
- Home
- :
- MCUXpresso Software and Tools
- :
- Kinetis Design Studio
- :
- The difference with CW
The difference with CW
- Subscribe to RSS Feed
- Mark Topic as New
- Mark Topic as Read
- Float this Topic for Current User
- Bookmark
- Subscribe
- Mute
- Printer Friendly Page
- Mark as New
- Bookmark
- Subscribe
- Mute
- Subscribe to RSS Feed
- Permalink
- Report Inappropriate Content
My KDS in running on ArchLinux 64bit.
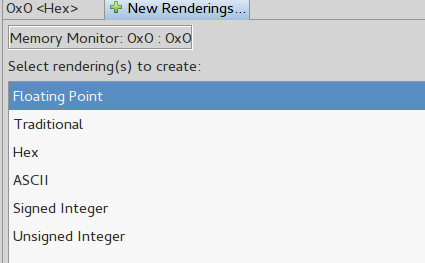
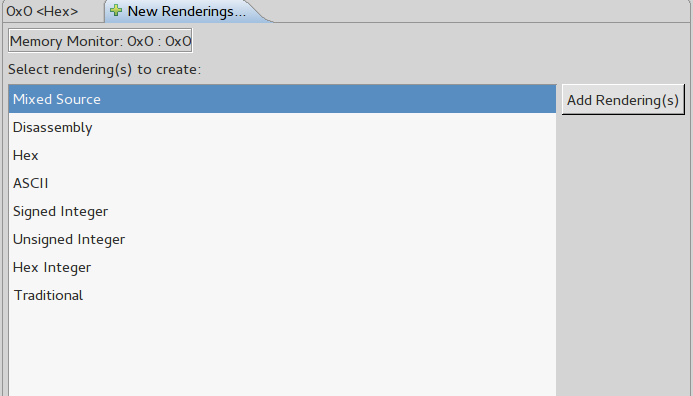
1: In CW, when I view the memory, there is a view render as HEX Integer format, while in KDS, I only can see HEX format, HEX format is byte array, while HEX Integer is integer array, please see below picture:
I thinks HEX integer is very useful in view the memory, could KDS team as this way in new KDS release ?
2: In CW, when I need a breakpoint I will enter this breakpoint in Debug Console likely this command : bp khci.c 1024, while in KDS I can't find this Debug Console, this is also a very useful feature.
KDS memory view:
CW memory view:
CW Debug Console:
Solved! Go to Solution.
- Mark as New
- Bookmark
- Subscribe
- Mute
- Subscribe to RSS Feed
- Permalink
- Report Inappropriate Content
There are two different views for memory in Eclipse:
- Memory View
- Memory Browser View
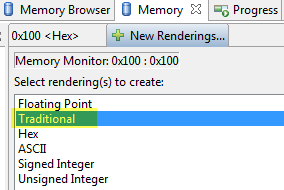
Each has its pros and cons. For 'embedded' memory views the 'traditional' rendering can be used:
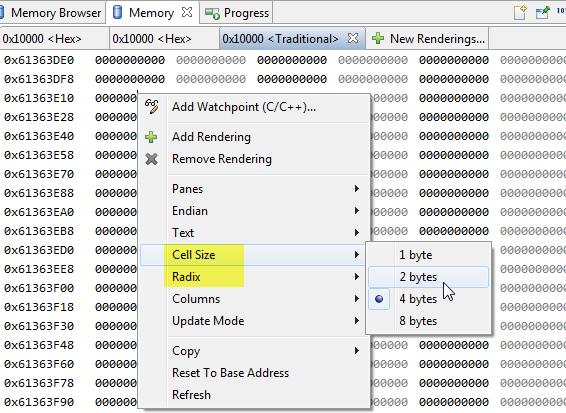
Then you can specify the cell size, or the radix (signed, unsigned, hexadecimal, ...)
As KDS is using GDB, you can use the normal GDB command line debugging. For this, open the corresponding arm-none-eabi-gdb console:
help breakpoints
gives you a quick help. Have a look as well at Debugging with GDB
For example 'break main' will set a breakpoint at main:
I hope that helps as a starter?
Erich
- Mark as New
- Bookmark
- Subscribe
- Mute
- Subscribe to RSS Feed
- Permalink
- Report Inappropriate Content
Thanks Erich!
That is the correct way just like in CW.
For GDB console, TAB key seem can't do auto completing the comamnd like in real GDB console. Is there a way do this ?
- Mark as New
- Bookmark
- Subscribe
- Mute
- Subscribe to RSS Feed
- Permalink
- Report Inappropriate Content
No, tab auto completion is not supported in the Eclispe GDB console, see c++ - Is there any enhanced gdb console for Eclipse? - Stack Overflow
- Mark as New
- Bookmark
- Subscribe
- Mute
- Subscribe to RSS Feed
- Permalink
- Report Inappropriate Content
Hi Erich, Got it, Thanks!


