
- Forums
- Product Forums
- General Purpose MicrocontrollersGeneral Purpose Microcontrollers
- i.MX Forumsi.MX Forums
- QorIQ Processing PlatformsQorIQ Processing Platforms
- Identification and SecurityIdentification and Security
- Power ManagementPower Management
- Wireless ConnectivityWireless Connectivity
- RFID / NFCRFID / NFC
- Advanced AnalogAdvanced Analog
- Neural Processing UnitsNeural Processing Units
- MCX Microcontrollers
- S32G
- S32K
- S32V
- MPC5xxx
- Other NXP Products
- S12 / MagniV Microcontrollers
- Powertrain and Electrification Analog Drivers
- Sensors
- Vybrid Processors
- Digital Signal Controllers
- 8-bit Microcontrollers
- ColdFire/68K Microcontrollers and Processors
- PowerQUICC Processors
- OSBDM and TBDML
- S32M
- S32Z/E
-
- Solution Forums
- Software Forums
- MCUXpresso Software and ToolsMCUXpresso Software and Tools
- CodeWarriorCodeWarrior
- MQX Software SolutionsMQX Software Solutions
- Model-Based Design Toolbox (MBDT)Model-Based Design Toolbox (MBDT)
- FreeMASTER
- eIQ Machine Learning Software
- Embedded Software and Tools Clinic
- S32 SDK
- S32 Design Studio
- GUI Guider
- Zephyr Project
- Voice Technology
- Application Software Packs
- Secure Provisioning SDK (SPSDK)
- Processor Expert Software
- Generative AI & LLMs
-
- Topics
- Mobile Robotics - Drones and RoversMobile Robotics - Drones and Rovers
- NXP Training ContentNXP Training Content
- University ProgramsUniversity Programs
- Rapid IoT
- NXP Designs
- SafeAssure-Community
- OSS Security & Maintenance
- Using Our Community
-
- Cloud Lab Forums
-
- Knowledge Bases
- ARM Microcontrollers
- i.MX Processors
- Identification and Security
- Model-Based Design Toolbox (MBDT)
- QorIQ Processing Platforms
- S32 Automotive Processing Platform
- Wireless Connectivity
- CodeWarrior
- MCUXpresso Suite of Software and Tools
- MQX Software Solutions
- RFID / NFC
- Advanced Analog
- Neural Processing Units
-
- NXP Tech Blogs
- Home
- :
- MCUXpressoソフトウェアとツール
- :
- Kinetisデザインスタジオ
- :
- K-64 Unable to Connect to GDBserver for Debug
K-64 Unable to Connect to GDBserver for Debug
- RSS フィードを購読する
- トピックを新着としてマーク
- トピックを既読としてマーク
- このトピックを現在のユーザーにフロートします
- ブックマーク
- 購読
- ミュート
- 印刷用ページ
K-64 Unable to Connect to GDBserver for Debug
- 新着としてマーク
- ブックマーク
- 購読
- ミュート
- RSS フィードを購読する
- ハイライト
- 印刷
- 不適切なコンテンツを報告
Hi All,
I'm having issue with KDS connecting to the gdbserver for debugging in KDS IDE after my computer is reset. Initially, I was able to have connection between KDS and gdbserver and debug the code without any issue. However, after i reset my computer, KDS keep hanging at 60 percent whenever i try to enter debug mode.
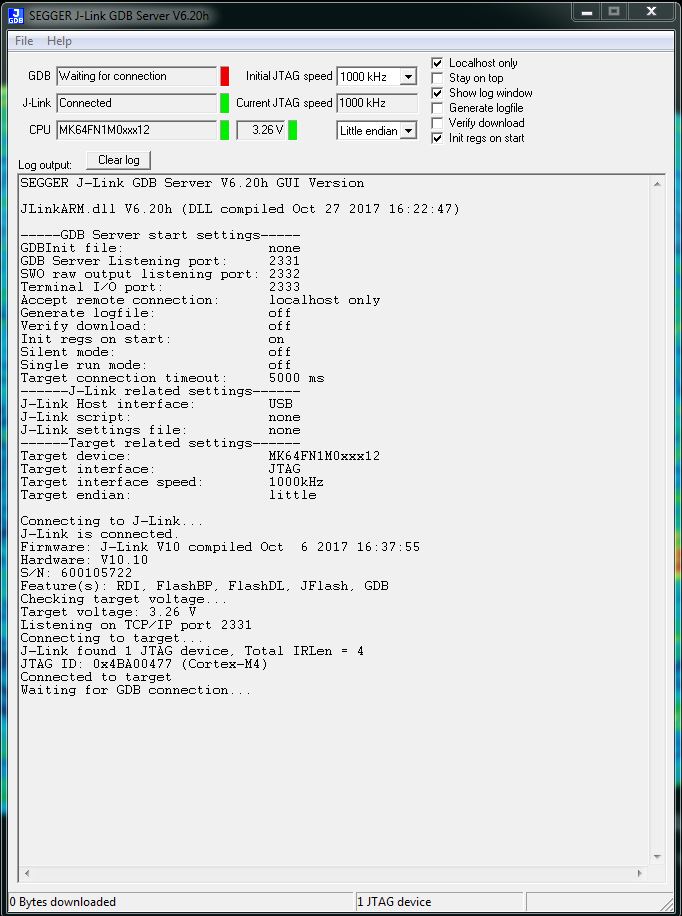
To verify whether there is still connection between my computer and the target i used SEGGER J-Link GDB server GUI and commander and noticed that the debugger probe is indeed connected to the K-64 MCU but not to the GDBServer, waiting for connection to GDB is the message i received.
I also attached a few images of the project setting in KDS for Segger debug probe that used to work and now failed.
What i did but didn't help solve the issue:
-------------------------------------------------------
-Reset and turn off the computer
-Removed all breakpoints
-Power cycled the target/host and debug probe
-Switched to using PEMicro Multilink
-Switched to using another laptop
-Created new workspace, and test project
Questions:
- Should I talk to IT to open certain ports or allow certain IP range ?
Thank you in advance for the help.
Vu
- 新着としてマーク
- ブックマーク
- 購読
- ミュート
- RSS フィードを購読する
- ハイライト
- 印刷
- 不適切なコンテンツを報告
Hi Erich and Marcelo,
I got this issue resolved after i uninstalled and installed the latest Kinetis Design Studio from NXP to get it to work reliably. Keep my fingers crossed.
Thanks,
Vu
- 新着としてマーク
- ブックマーク
- 購読
- ミュート
- RSS フィードを購読する
- ハイライト
- 印刷
- 不適切なコンテンツを報告
MCUXpresso is VERY unstable. I am able to debug my app until I get a random "unrecoverable" unable to connect situation. The only way it resumes working is if I use Segger JTAG via IAR IDE. Then I can close IAR and restart MCUXpresso IDE and it may work for a while until stop working once again.
Logs from Windows 10 machine:
SEGGER J-Link GDB Server V6.20g Command Line Version
JLinkARM.dll V6.20g (DLL compiled Oct 20 2017 17:09:27)
Command line: -nosilent -swoport 2337 -select USB=203200565 -telnetport 2338 -singlerun -endian little -noir -speed auto -port 2339 -vd -device MK66FN2M0xxx18 -if SWD -halt -reportuseraction
-----GDB Server start settings-----
GDBInit file: none
GDB Server Listening port: 2339
SWO raw output listening port: 2337
Terminal I/O port: 2338
Accept remote connection: localhost only
Generate logfile: off
Verify download: on
Init regs on start: off
Silent mode: off
Single run mode: on
Target connection timeout: 0 ms
------J-Link related settings------
J-Link Host interface: USB
J-Link script: none
J-Link settings file: none
------Target related settings------
Target device: MK66FN2M0xxx18
Target interface: SWD
Target interface speed: auto
Target endian: little
Connecting to J-Link...
J-Link is connected.
Device "MK66FN2M0XXX18" selected.
Firmware: J-Trace Cortex-M Rev.3 compiled May 22 2017 18:32:06
Hardware: V3.10
S/N: 203200565
Feature(s): RDI, FlashBP, FlashDL, JFlash, GDB
Checking target voltage...
Target voltage: 3.31 V
Listening on TCP/IP port 2339
Connecting to target...InitTarget()
Found SW-DP with ID 0x2BA01477
Scanning AP map to find all available APs
AP[2]: Stopped AP scan as end of AP map has been reached
AP[0]: AHB-AP (IDR: 0x24770011)
AP[1]: JTAG-AP (IDR: 0x001C0000)
Iterating through AP map to find AHB-AP to use
AP[0]: Skipped. Invalid implementer code read from CPUIDVal[31:24] = 0x00
AP[1]: Skipped. Not an AHB-AP
InitTarget()
Connect Under Reset
Communication error while accessing MDM-AP.
Connect Under Reset
ERROR: Could not find core in Coresight setup
Communication timed out: Requested 20 bytes, received 0 bytes !
Could not transfer JTAG data.
InitTarget(): PCode returned with error code -1
ERROR: Could not connect to target.
Target conneWARctiNINGon : Targefailed. t conneGDBServectr will beion los closet.
d...Restoring target state and closing J-Link connection...
Shutting down...
Could not connect to target.
Please check power, connection and settings.
Tried on Mac OSX and it also does not work probably for other reasons.
- 新着としてマーク
- ブックマーク
- 購読
- ミュート
- RSS フィードを購読する
- ハイライト
- 印刷
- 不適切なコンテンツを報告
Hi Marcelo,
I have seen things like that if using different IDEs with using different Segger J-Link DLLs. I suggest you run
C:\Program Files (x86)\SEGGER\JLink_V620g\JLinkDLLUpdater.exe
and make sure all IDEs are using the same version of the Segger runtime libraries.
I hope this helps,
Erich
- 新着としてマーク
- ブックマーク
- 購読
- ミュート
- RSS フィードを購読する
- ハイライト
- 印刷
- 不適切なコンテンツを報告
I see that you are already using V6.20h of the Segger software. I'm using V6.20g and have not seen something like this, so it could be that this is because of that new version? If this problem did not occur with an earlier version, I would downgrade the Segger version to say V6.20g to single out that possible reason.
I hope this helps,
Erich
- 新着としてマーク
- ブックマーク
- 購読
- ミュート
- RSS フィードを購読する
- ハイライト
- 印刷
- 不適切なコンテンツを報告
Hi Erich,
Thank you for your suggestion, I will install an older version of Segger software. Do I need to modify my computer firewall or antivirus software to allow certain ports or IP to go through? Or is there an issue with my hardware?
Thanks,
Vu
- 新着としてマーク
- ブックマーク
- 購読
- ミュート
- RSS フィードを購読する
- ハイライト
- 印刷
- 不適切なコンテンツを報告
Hi Vu,
Firewalls and virus scanners are always a concern, but I don't thin this is the case.
I see that you have specified a USB port in the segger configuration which is not really necessary (it will ask you if you have multiple probes connected). What is strange that it does not work for you with the P&E connection too. So this means either you have a fundamental problem with your host PC.
After re-reading things, I'm puzzled what you mean by 'reset my computer'?
I hope this helps,
Erich
- 新着としてマーク
- ブックマーク
- 購読
- ミュート
- RSS フィードを購読する
- ハイライト
- 印刷
- 不適切なコンテンツを報告
Hi Erich,
Thank you very much for your replies. I just finished downloaded and installed Segger software version 6.20g on my computer. However, the SEGGER GDB Software GUI still refuses to establish connection with the GDB server. On the other hand, this morning KDS decided to connect to the GDB server and i'm able to debug my code at the moment.
You mentioned about potential fundamental problems with my host computer. What kind of issues should i look into ?
BR,
Vu