- Forums
- Product Forums
- General Purpose MicrocontrollersGeneral Purpose Microcontrollers
- i.MX Forumsi.MX Forums
- QorIQ Processing PlatformsQorIQ Processing Platforms
- Identification and SecurityIdentification and Security
- Power ManagementPower Management
- Wireless ConnectivityWireless Connectivity
- RFID / NFCRFID / NFC
- Advanced AnalogAdvanced Analog
- MCX Microcontrollers
- S32G
- S32K
- S32V
- MPC5xxx
- Other NXP Products
- S12 / MagniV Microcontrollers
- Powertrain and Electrification Analog Drivers
- Sensors
- Vybrid Processors
- Digital Signal Controllers
- 8-bit Microcontrollers
- ColdFire/68K Microcontrollers and Processors
- PowerQUICC Processors
- OSBDM and TBDML
- S32M
- S32Z/E
-
- Solution Forums
- Software Forums
- MCUXpresso Software and ToolsMCUXpresso Software and Tools
- CodeWarriorCodeWarrior
- MQX Software SolutionsMQX Software Solutions
- Model-Based Design Toolbox (MBDT)Model-Based Design Toolbox (MBDT)
- FreeMASTER
- eIQ Machine Learning Software
- Embedded Software and Tools Clinic
- S32 SDK
- S32 Design Studio
- GUI Guider
- Zephyr Project
- Voice Technology
- Application Software Packs
- Secure Provisioning SDK (SPSDK)
- Processor Expert Software
- Generative AI & LLMs
-
- Topics
- Mobile Robotics - Drones and RoversMobile Robotics - Drones and Rovers
- NXP Training ContentNXP Training Content
- University ProgramsUniversity Programs
- Rapid IoT
- NXP Designs
- SafeAssure-Community
- OSS Security & Maintenance
- Using Our Community
-
- Cloud Lab Forums
-
- Knowledge Bases
- ARM Microcontrollers
- i.MX Processors
- Identification and Security
- Model-Based Design Toolbox (MBDT)
- QorIQ Processing Platforms
- S32 Automotive Processing Platform
- Wireless Connectivity
- CodeWarrior
- MCUXpresso Suite of Software and Tools
- MQX Software Solutions
- RFID / NFC
- Advanced Analog
-
- NXP Tech Blogs
- Home
- :
- CodeWarrior
- :
- CodeWarrior Development Tools
- :
- Re: CodeWarrior 10.6 with MQX 4.0 debugger issue
CodeWarrior 10.6 with MQX 4.0 debugger issue
- Subscribe to RSS Feed
- Mark Topic as New
- Mark Topic as Read
- Float this Topic for Current User
- Bookmark
- Subscribe
- Mute
- Printer Friendly Page
CodeWarrior 10.6 with MQX 4.0 debugger issue
- Mark as New
- Bookmark
- Subscribe
- Mute
- Subscribe to RSS Feed
- Permalink
- Report Inappropriate Content
Hi,
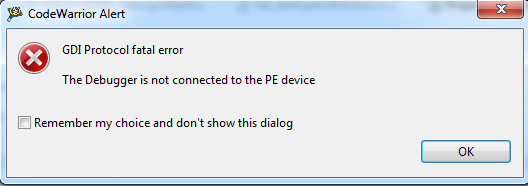
I recently upgraded my CW software from 10.2 to 10.6. However when I try to debug my application with BSP of MQX 4.0, there was this problem "GDI Protocol fatal error" "The Debugger is not connected to PE device". I am suing PE micro Multilink Universal as my programmer/debugger. I search the forums and I saw a suggestion of updating the driver and then closing CW and re launch with new project workspace. I tried this method but to no avail. I then tried to install MQX 4.2 and debug one of the example programs. I can debug without any problems.
You might asked then just used 4.2 instead? My target platform is Kinetis TWR60d100. And I am still using CW compiler. I have not switch to GNU C Compiler yet. On MQX 4.2 there is no BSP for my target platform. And I am hesitant to convert my application to GNU C as it will cause a ton of problems ( align, etc).
Is there anything I need to do to be able to debug under CW 10.6/MQX 4.0? Or is this a limitation like I read on 1 of the questions here in forum about no support for MQX 3.8 in CW 10.6.
FYI
I can see that the chip was programmed correctly, but when I try to break then this dialog box pops out.
Thanks in advance for the help.
- Mark as New
- Bookmark
- Subscribe
- Mute
- Subscribe to RSS Feed
- Permalink
- Report Inappropriate Content
Hi,
Anybody out there with similar problems?
Thanks.
- Mark as New
- Bookmark
- Subscribe
- Mute
- Subscribe to RSS Feed
- Permalink
- Report Inappropriate Content
hi,
MQX 3.8 was developed to work with CW MCU v10.1. It is not supported in CW MCU v10.6.
MQX Task Aware Debugger is integrated with CW MCU v10.6 and is automatically installed. This plug-in can be used with all supported MQX versions (i.e. MQX 4.0.x, MQX 4.1, MQX4.2 and MQX Lite).
Have a great day,
Jennie Zhang
-----------------------------------------------------------------------------------------------------------------------
Note: If this post answers your question, please click the Correct Answer button. Thank you!
-----------------------------------------------------------------------------------------------------------------------
- Mark as New
- Bookmark
- Subscribe
- Mute
- Subscribe to RSS Feed
- Permalink
- Report Inappropriate Content
Hi Jennie,
I am not using 3.8. I just cited it as an example for not being supported in CW 10.6. I am using 4.0 as my MQX. If you could read the first part of my message I mentioned my problems on using 4.0 and CW 10.6 with CW compiler.
Thanks.
- Mark as New
- Bookmark
- Subscribe
- Mute
- Subscribe to RSS Feed
- Permalink
- Report Inappropriate Content
Vines,
normally the error message "GDI Protocol fatal error" "The Debugger is not connected to PE device" are not because of the compatibility of CW and MQX version, but a target connection problem.
what debug interface do you work with?
How is the connection work if you create a new project with wizard without MQX support?
Have a great day,
Jennie Zhang
-----------------------------------------------------------------------------------------------------------------------
Note: If this post answers your question, please click the Correct Answer button. Thank you!
-----------------------------------------------------------------------------------------------------------------------
- Mark as New
- Bookmark
- Subscribe
- Mute
- Subscribe to RSS Feed
- Permalink
- Report Inappropriate Content
Hi Jennie,
When you say connection problem is it the physical connection between programmer to target board? If that is the case, I doubt so. I'll explain why.
I still maintain a CW 10.2 version on my PC. I can debug the same project without an issue using the same PE micro Multilink Universal setup. Then using the same setup, I close CW 10.2 and open my project and try to debug on 10.6 I will have this error.
- Mark as New
- Bookmark
- Subscribe
- Mute
- Subscribe to RSS Feed
- Permalink
- Report Inappropriate Content
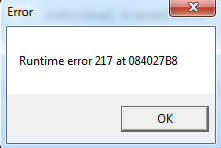
Also after clicking OK in the dialog box "GDI Protocol fatal error" "The Debugger is not connected to PE device" there is another pop up dialog shown below.
Thanks,
Carlo
- Mark as New
- Bookmark
- Subscribe
- Mute
- Subscribe to RSS Feed
- Permalink
- Report Inappropriate Content
Hi,
I ever have similar problem and I fixed the problem by create a new workspace and update the multilink universal driver to the latest.
the driver is included in USB Multilink Universal (and FX) Resource CD from this url
there is also a discussion about this problem, can you please check if this can help.
Have a great day,
Jennie Zhang
-----------------------------------------------------------------------------------------------------------------------
Note: If this post answers your question, please click the Correct Answer button. Thank you!
-----------------------------------------------------------------------------------------------------------------------

