
- NXP Forums
- Product Forums
- General Purpose MicrocontrollersGeneral Purpose Microcontrollers
- i.MX Forumsi.MX Forums
- QorIQ Processing PlatformsQorIQ Processing Platforms
- Identification and SecurityIdentification and Security
- Power ManagementPower Management
- MCX Microcontrollers
- S32G
- S32K
- S32V
- MPC5xxx
- Other NXP Products
- Wireless Connectivity
- S12 / MagniV Microcontrollers
- Powertrain and Electrification Analog Drivers
- Sensors
- Vybrid Processors
- Digital Signal Controllers
- 8-bit Microcontrollers
- ColdFire/68K Microcontrollers and Processors
- PowerQUICC Processors
- OSBDM and TBDML
-
- Solution Forums
- Software Forums
- MCUXpresso Software and ToolsMCUXpresso Software and Tools
- CodeWarriorCodeWarrior
- MQX Software SolutionsMQX Software Solutions
- Model-Based Design Toolbox (MBDT)Model-Based Design Toolbox (MBDT)
- FreeMASTER
- eIQ Machine Learning Software
- Embedded Software and Tools Clinic
- S32 SDK
- S32 Design Studio
- Vigiles
- GUI Guider
- Zephyr Project
- Voice Technology
- Application Software Packs
- Secure Provisioning SDK (SPSDK)
- Processor Expert Software
-
- Topics
- Mobile Robotics - Drones and RoversMobile Robotics - Drones and Rovers
- NXP Training ContentNXP Training Content
- University ProgramsUniversity Programs
- Rapid IoT
- NXP Designs
- SafeAssure-Community
- OSS Security & Maintenance
- Using Our Community
-
-
Tutorial: MCUXpresso SDK with Linux, Part 2: Commandline Debugging with GDB
Tutorial: MCUXpresso SDK with Linux, Part 2: Commandline Debugging with GDB
- Subscribe to RSS Feed
- Mark as New
- Mark as Read
- Bookmark
- Subscribe
- Printer Friendly Page
- Report Inappropriate Content
In “Tutorial: MCUXpresso SDK with Linux, Part 1: Installation and Build with Maked” I used cmake and make to build the SDK application. In this part I’m going to use the command line gdb to debug the application on the board.

Cross-Debugging with GDB
List of this multi-part tutorial:
- Tutorial: MCUXpresso SDK with Linux, Part 1: Installation and Build with Make
- Tutorial: MCUXpresso SDK with Linux, Part 2: Commandline Debugging with GDB
Outline
In this tutorial I’m going through the steps to install and use the GNU debugger (gdb) from the console to debug the application on the board. I’m running the Ubuntu Linux in a VM on Windows. I’m using the NXP FRDM-K64F board, but the steps are applicable to any other board.

NXP FRDM-K64F
While this tutorial is using gdb and the command line, the Eclipse based MCUXpresso IDE can be used instead too: this way might be easier for most developers as with using Eclipse things are handled automatically.
For an earlier overview about command line debugging with GDB, see “Command Line Programming and Debugging with GDB“.

GDB Debugging Chain
Debug Connections
The board I’m using has a on-board debug circuit (OpenSDA) which can used either as a CMSIS-DAP (with a LPC-Link2), SEGGER J-Link or P&E Multilink. The board has a standard 10pin SWD debug header, so an external debug probe can used too:
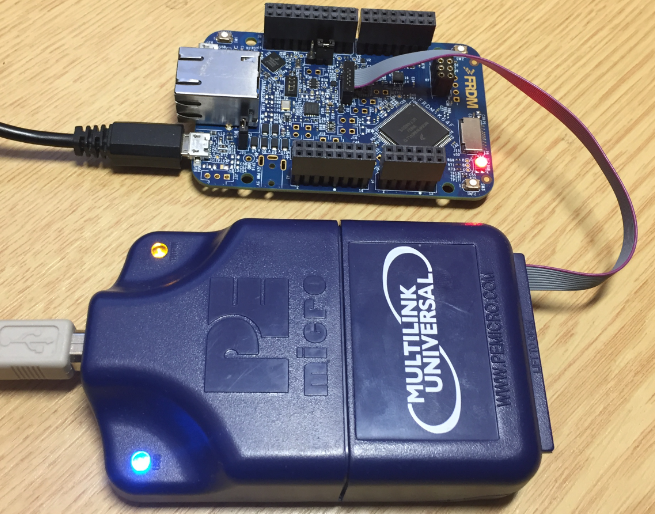
Debugging FreeRTOS on NXP FRDM-K64F with P&E Multilink Universal

LPC-Link2 debugging FRDM-K64F

J-Link Hooked Up to recover the K64F
GDB Client
GDB is using a client-server connection: the GDB client is rather generic, while the server part is making the connection to the target and/or implements the connection to the board.
In the case of using Eclipse, the GDB client is integrated with Eclipse:

GDB with GDB Server
But the gdb client in fact is a command line tool like the compiler, and it can be started on the command line too:
$ ~/opt/gcc-arm-none-eabi-8-2018-q4-major/bin/arm-none-eabi-gdb
See “Tutorial: MCUXpresso SDK with Linux, Part 1: Installation and Build with Make” about the GNU and gdb tool installation.
This launches the GDB client which then waits for commands:

Launched GDB
I prefer to run the gdb client in one console window. So for the next parts (server for P&E and SEGGER) I use a different console.
SEGGER J-Link GDB Server
To work with the board using a SEGGER probe, I have to install the J-Link software first. The download is available from https://www.segger.com/downloads/jlink/#J- LinkSoftwareAndDocumentationPack
For my environment I have downloaded the JLink_Linux_V644g_x86_64.deb file. For a RedHat system the .rpm would be the choice to use. To install it:
$ sudo apt install ./JLink_Linux_V644g_x86_64.deb
The files get installed into \opt\bin. I can verify that it works properly with calling the GDB server:
$ /usr/bin/JLinkGDBServer
Which produces something like this:
SEGGER J-Link GDB Server V6.44g Command Line Version JLinkARM.dll V6.44g (DLL compiled Apr 18 2019 17:15:02) -----GDB Server start settings----- GDBInit file: none GDB Server Listening port: 2331 SWO raw output listening port: 2332 Terminal I/O port: 2333 Accept remote connection: yes Generate logfile: off Verify download: off Init regs on start: off Silent mode: off Single run mode: off Target connection timeout: 0 ms ------J-Link related settings------ J-Link Host interface: USB J-Link script: none J-Link settings file: none ------Target related settings------ Target device: Unspecified Target interface: JTAG Target interface speed: 4000kHz Target endian: little Connecting to J-Link... Connecting to J-Link failed. Connected correctly? GDBServer will be closed... Shutting down... Could not connect to J-Link.
For how the GDB client and server connection works, see “GDB Client and Server: Unlocking GDB“.
The above output is produced with no J-Link debug probe attached. If using a USB based probe with the VM, make sure the USB port is available to the VM:

Using USB in VirtualBox
With this, the probe is detected:
SEGGER J-Link GDB Server V6.44g Command Line Version JLinkARM.dll V6.44g (DLL compiled Apr 18 2019 17:15:02) -----GDB Server start settings----- GDBInit file: none GDB Server Listening port: 2331 SWO raw output listening port: 2332 Terminal I/O port: 2333 Accept remote connection: yes Generate logfile: off Verify download: off Init regs on start: off Silent mode: off Single run mode: off Target connection timeout: 0 ms ------J-Link related settings------ J-Link Host interface: USB J-Link script: none J-Link settings file: none ------Target related settings------ Target device: Unspecified Target interface: JTAG Target interface speed: 4000kHz Target endian: little Connecting to J-Link... J-Link is connected. Failed to set device (Unspecified). Unknown device selected?ERROR : Failed to set device. Firmware: J-Link OpenSDA 2 compiled Jun 28 2018 09:44:47 Hardware: V1.00 S/N: 621000000 Checking target voltage... Target voltage: 3.30 V Listening on TCP/IP port 2331 Connecting to target...ERROR: Debugger tries to select target interface JTAG. This interface is not supported by the connected emulator. Selection will be ignored by the DLL. ERROR: No CPU core or target device has been selected. Please make sure at least the core J-Link shall connect to, is selected. ERROR: Could not connect to target. Target connection failed. GDBServer will be closed...Restoring target state and closing J-Link connection... Shutting down... Could not connect to target.
The end of the message indicates that we are trying to connect to a JTAG interface which is not supported. Indeed, the OpenSDA circuit on the FRDM-K64F board only supports SWD. To use SWD, the -if swd option has to be added:
$ /usr/bin/JLinkGDBServer -if swd
In addition to that, the device has to be selected using the -device option:
$ /usr/bin/JLinkGDBServer -if swd -device MK64FN1M0xxx12
The list of devices are available from https://www.segger.com/downloads/supported-devices.php
With this, the SEGGER gdb server waits for the client connection:
SEGGER J-Link GDB Server V6.44g Command Line Version JLinkARM.dll V6.44g (DLL compiled Apr 18 2019 17:15:02) Command line: -if swd -device MK64FN1M0xxx12 -----GDB Server start settings----- GDBInit file: none GDB Server Listening port: 2331 SWO raw output listening port: 2332 Terminal I/O port: 2333 Accept remote connection: yes Generate logfile: off Verify download: off Init regs on start: off Silent mode: off Single run mode: off Target connection timeout: 0 ms ------J-Link related settings------ J-Link Host interface: USB J-Link script: none J-Link settings file: none ------Target related settings------ Target device: MK64FN1M0xxx12 Target interface: SWD Target interface speed: 4000kHz Target endian: little Connecting to J-Link... J-Link is connected. Firmware: J-Link OpenSDA 2 compiled Jun 28 2018 09:44:47 Hardware: V1.00 S/N: 621000000 Checking target voltage... Target voltage: 3.30 V Listening on TCP/IP port 2331 Connecting to target...Connected to target Waiting for GDB connection...
The SEGGER server is listening on port 2331, so I connect to that port from the gdb client:
(gdb) target remote localhost:2331

GDB Client and Server
From the client, I can reset the target:
(gdb) monitor reset
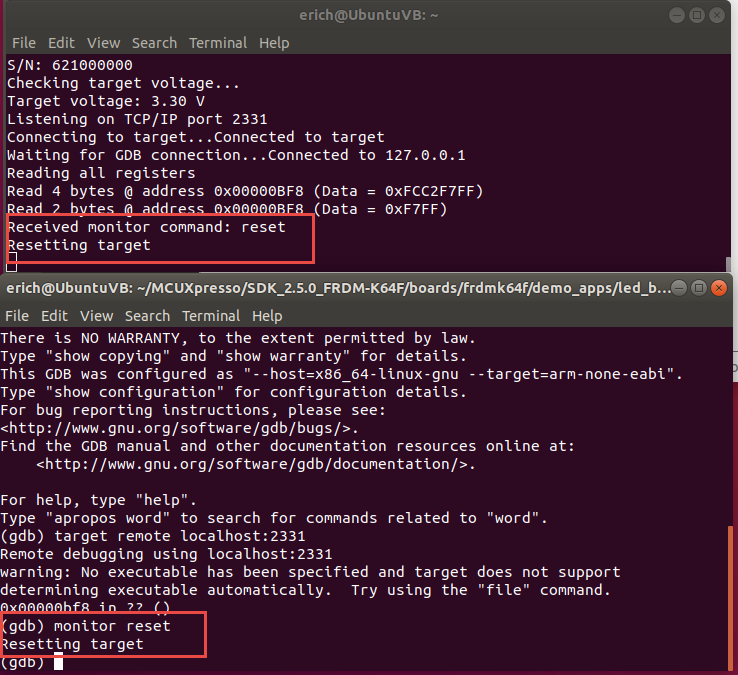
monitor reset
To load the binary, I use
(gdb) load debug/led_blinky.elf

load binary
followed by loading the symbols (debug information):
(gdb) file debug/led_blinky.elf

loaded symbols
To set a breakpoint on main:
(gdb) b main
and to continue execution:
(gdb) c
This will hit the breakpoint on main:

Hit breakpoint on main
GDB has many commands, for example check the following cheat sheets:
- https://darkdust.net/files/GDB%20Cheat%20Sheet.pdf
- http://www.yolinux.com/TUTORIALS/GDB-Commands.html
- https://www.cs.princeton.edu/courses/archive/fall16/cos432/hw2/gdb-refcard.pdf
To quit the gdb debug session:
(gdb) q
PEMicro (P&E)
Everyting said above applies to the P&E (PEMICRO) debug connection too. The P&E debug probes (e.g. Multilink) use their own GDB. That GDB Serve and drivers are integrated in Eclipse (e.g. NXP MCUXpresso IDE)
I recommend to download and install the MCUXpresso IDE for Linux as it comes with the latest P&E plugins and drivers. That way the USB drivers and GDB server don’t need to be installed manually as described below.
Download the P&E Linux drivers from http://www.pemicro.com/opensda/ and unzip the file:
$ gunzip pemicro-other-20181128.zip.tar.gz
untar the archive:
$ tar -xvf pemicro-other-20181128.zip.tar
$ cd pemicro-other-20181128/drivers/libusb_64_32/
untar the drivers:
$ tar -xvf linux_drivers_64bit_58_b181128.tar.gz
Install the drivers
$ cd libusb_64_32 $ sudo ./setup.sh
Now with the USB drivers installed, we need the P&E GDB Server which is inside the P&E Eclipse plugin. The Eclipse plugin is available as direct download from
https://www.pemicro.com/products/product_viewDetails.cfm?product_id=15320151&productTab=1
Again: I recommend to download and install the MCUXpresso IDE for Linux as it comes with the latest P&E plugins.
unzip the jar file (replace the file name with the one you have downloaded):
$ unzip com.pemicro.debug.gdbjtag.pne_3.0.9.201707131553.jar -d pnegdbserver
make the gdb server executable:
$ cd pnegdbserver $ chmod +x pegdbserver_console
Make sure the P&E Device and driver is available for the Linux VM:

PEMicro USB
The list of supported devices can be displayed with
$ ./pegdbserver_console -devicelist
Then launch the server. Specify -startserver and the -device used. For FRDM-K64F I use
$ ./pegdbserver_console -startserver -device=NXP_K6x_K64FN1M0M12
With this I have the server running:
P&E GDB Server for Arm(R) devices, Version 6.45.00.00 Copyright 2014, P&E Microcomputer Systems Inc, All rights reserved Loading library /home/erich/MCUXpresso/pemicro/pnegdbserver/lin/gdi/unit_ngs_arm_internal.so ... Done. Command line arguments: -startserver -device=NXP_K6x_K64FN1M0M12 Device selected is NXP_K6x_K64FN1M0M12 HW Auto-Selected : Interface=USBMULTILINK Port=PEM6B012B ; USB1 : Multilink Universal FX Rev C (PEM6B012B) Connecting to target. P&E Interface detected - Flash Version 10.15 Device is NXP_K6x_K64FN1M0M12. Mode is In-Circuit Debug. (C)opyright 2012, P&E Microcomputer Systems, Inc. (www.pemicro.com) API version is 101 Creating kernel driver for freertos Server 1 running on 127.0.0.1:7224 Server 2 running on 127.0.0.1:7226 Server 3 running on 127.0.0.1:7228 Server 4 running on 127.0.0.1:7230 Server 5 running on 127.0.0.1:7232 Server 6 running on 127.0.0.1:7234 All Servers Running
Start the gdb client in a different console:
$ ~/opt/gcc-arm-none-eabi-8-2018-q4-major/bin/arm-none-eabi-gdb
The P&E GDB server is listening on port 7224, so I use the following in the gdb client:
(gdb) target remote localhost:7224
From now on, I can use gdb to talk to the target. To reset the target:
(gdb) monitor reset
to load the binary and the symbols, setting a breakpoint on main and run:
(gdb) load debug/led_blinky.elf (gdb) file debug/led_blinky.elf (gdb) b main (gdb) c

Debugging with P&E gdbserver
To terminate the debug session:
(gdb) q
Automation
Instead using the gdb client in interactive mode, I can script it for example to program the application. For example create following script file:
set pagination off target remote localhost:2331 monitor reset load debug/led_blinky.elf quit gdb script file
Then launch the script file with
$ ~/opt/gcc-arm-none-eabi-8-2018-q4-major/bin/arm-none-eabi-gdb -x gdb_flash.script
Summary
It is possible to use gdb in command line mode on Linux with the NXP MCUXpresso SDK, so this is applicable for a very small setup. It works well for the SEGGER and PEMICRO debug connections, as their driver/installer cares about the USB connection, so using that is fairly easy. Using the gdb command line is very powerful, but is for sure not as intuitive as using an Eclipse IDE as the MCUXpresso IDE, but certainly doable. Using gdb in command line mode on the other side is a good option to do automated testing at least.
Happy debugging
Links
- Part 1: Tutorial: MCUXpresso SDK with Linux, Part 1: Installation and Build with Maked
- Oracle VirtualBox: https://www.virtualbox.org/
- Ubuntu Linux: https://www.ubuntu.com
- NXP MCUXpresso SDK web site: https://mcuxpresso.nxp.com
- NXP FRDM-K64F Board: https://www.nxp.com/support/developer-resources/evaluation-and-development-boards/freedom-developmen...
- GNU Toolchain for ARM Embedded: https://developer.arm.com/tools-and-software/open-source-software/developer-tools/gnu-toolchain/gnu-...
- CMake: https://cmake.org/
- MCUXpresso IDE: http://www.nxp.com/mcuxpresso/ide
- J-Link Manual: UM08001
- Command Line Programming and Debugging with GDB
- https://github.com/mbedmicro/pyOCD
- udev rules on Linux: https://github.com/mbedmicro/pyOCD/blob/master/udev/README.md
- - -
Originally published on April 20, 2019 by Erich Styger
You must be a registered user to add a comment. If you've already registered, sign in. Otherwise, register and sign in.
-
101
6 -
communication standards
4 -
General Purpose Microcontrollers
19 -
i.MX RT Processors
45 -
i.MX Processors
43 -
introduction
9 -
LPC Microcontrollers
73 -
MCUXpresso
32 -
MCUXpresso Secure Provisioning Tool
1 -
MCUXpresso Conig Tools
30 -
MCUXpresso IDE
40 -
MCUXpresso SDK
25 -
Model-Based Design Toolbox
6 -
MQX Software Solutions
2 -
QorIQ Processing Platforms
1 -
QorIQ Devices
5 -
S32N Processors
4 -
S32Z|E Processors
6 -
SW | Downloads
4
- « Previous
- Next »