- NXP Forums
- Product Forums
- General Purpose MicrocontrollersGeneral Purpose Microcontrollers
- i.MX Forumsi.MX Forums
- QorIQ Processing PlatformsQorIQ Processing Platforms
- Identification and SecurityIdentification and Security
- Power ManagementPower Management
- MCX Microcontrollers
- S32G
- S32K
- S32V
- MPC5xxx
- Other NXP Products
- Wireless Connectivity
- S12 / MagniV Microcontrollers
- Powertrain and Electrification Analog Drivers
- Sensors
- Vybrid Processors
- Digital Signal Controllers
- 8-bit Microcontrollers
- ColdFire/68K Microcontrollers and Processors
- PowerQUICC Processors
- OSBDM and TBDML
-
- Solution Forums
- Software Forums
- MCUXpresso Software and ToolsMCUXpresso Software and Tools
- CodeWarriorCodeWarrior
- MQX Software SolutionsMQX Software Solutions
- Model-Based Design Toolbox (MBDT)Model-Based Design Toolbox (MBDT)
- FreeMASTER
- eIQ Machine Learning Software
- Embedded Software and Tools Clinic
- S32 SDK
- S32 Design Studio
- Vigiles
- GUI Guider
- Zephyr Project
- Voice Technology
- Application Software Packs
- Secure Provisioning SDK (SPSDK)
- Processor Expert Software
-
- Topics
- Mobile Robotics - Drones and RoversMobile Robotics - Drones and Rovers
- NXP Training ContentNXP Training Content
- University ProgramsUniversity Programs
- Rapid IoT
- NXP Designs
- SafeAssure-Community
- OSS Security & Maintenance
- Using Our Community
-
-
- Home
- :
- MCUXpresso Software and Tools
- :
- MCUXpresso IDE
- :
- Re: MCUX 11.0.0 - Variables view has blank contents
MCUX 11.0.0 - Variables view has blank contents
- Subscribe to RSS Feed
- Mark Topic as New
- Mark Topic as Read
- Float this Topic for Current User
- Bookmark
- Subscribe
- Mute
- Printer Friendly Page
- Mark as New
- Bookmark
- Subscribe
- Mute
- Subscribe to RSS Feed
- Permalink
- Report Inappropriate Content
(EDIT -- This thread was previously titled "MCUX 11.0.0 - 'this' not visible in Variables view", but it was eventually pointed out (derp) that static methods have no "this" pointer available. However, in the course of investigating this issue, I discovered that the Variables view would often appear with blank contents. The original thread appears below; the comments with screenshots show the issue with blank Variables view data.)
TL;DR - "this" no longer appears in the Variables view when debugging a C++ class.
So, I've pulled down MCUX v11.0.0 and installed it... I've also grabbed SDK v2.6.0 for the RT1050. I created a brand new workspace, set my templates and code style, set my hotkeys, installed the SDK, created a new C++ application, picked all the middleware, merged in all my previous application code, merged in my preprocessor defines and include directories, and after a bit of fiddling, got my "new" application to build. It even downloaded and ran the first time, which I'm thankful for.
However, my code got hung up during initialization, hmm. So I drill in with the debugger:
Now, upon reflection, I understand why this function failed... I haven't yet gone in and re-arranged the heap, stack, and data segments, so they're still pointing to internal SRAM, and I'm pretty sure the heap just ran out of memory, thus yielding a null pointer.
But what concerns me is the Variables view. I'm in the NxpLpi2c::CreateInstance() method, which means I'm inside the NxpLpi2c class. When I've debugged with MCUX in the past, there's always been a "this" symbol automatically added to the Variables view when debugging C++ methods. So... where did it go? It is invaluable to have access to the current object in the Variables view. Please tell me this is an easily remedied oversight. Thanks.
Solved! Go to Solution.
- Mark as New
- Bookmark
- Subscribe
- Mute
- Subscribe to RSS Feed
- Permalink
- Report Inappropriate Content
Emphasizing that the problem can be replicated only on v11.0.0 is probably a very important aspect. And we're still looking into the issues reported. However, for everyone experiencing problems with Variables or Expressions views, please try disabling "Live Variables" service when using PEMicro/JLink probes. This can be achieved by going to Window => Preferences => Expand "MCUXpresso IDE" categoy => Select "J-Link Options" or "PEMicro Options => Uncheck "Enable Live Variables service".
Greetings,
MCUXpresso IDE Support
- Mark as New
- Bookmark
- Subscribe
- Mute
- Subscribe to RSS Feed
- Permalink
- Report Inappropriate Content
Hi David,
I see you are in great trouble with all these items the MCUXpresso has. I noticed all of them, too. And I think it is a good point to write such a comment as it is VERY annoying to have run into so many items, hoping with a new version everything would become better - and what happens is quite the contrary.
So, I also have an installation of version 11.0 on my PC but still the 10.3 is there and after a few trials of the 11 I decided to go back to the 10.3, and with all I (or we?) learned about the 10.3 it is working, at least when not using the global variable view.
What if you need software from a SDK2.6? Well, I imported a SDK2.6 sample project with 11.0 and on going back, I could import this into the v10.3 and compile / run successfully. (My project is also a K66 with a JLink, but with a proprietary board).
As it is not the first time and I am not the only one who has a bigger C++ project to be developed on a NXP microcontroller, I cannot find it an appropriate reaction to say "we cannot reproduce your issue". Very bad for confidence. The chips are OK but the development environment is the "crack", at least at the moment. It cost me lots of time and in this project also lots of money. For me, not recommendable to others in this state.
- Mark as New
- Bookmark
- Subscribe
- Mute
- Subscribe to RSS Feed
- Permalink
- Report Inappropriate Content
You do bring up a good point, there's nothing stopping me from generating a new SDK 2.6.0 project (or taking the one I have) and building it under MCUX 10.3. I would lose the benefit of the updated GNU compiler, as well as the latest version of MCU Config Tools, but otherwise it should work. I can't use 10.3.1 though, that has the C/C++ indexing bug, and that would drive (and has driven) me crazy. The Global Variables thing doesn't bother me, I've honestly never used that... and it turns out that was (and still is, if not mitigated) the source of a lot of pain as well. The only views I use in the debugger are source, call stack (with RTOS awareness), breakpoints, and variables, and very occasionally modules/peripherals if I'm writing a driver. I don't ask a lot from a debugger, but I do ask that it at least does what it says on the tin.
"As it is not the first time and I am not the only one who has a bigger C++ project to be developed on a NXP microcontroller, I cannot find it an appropriate reaction to say "we cannot reproduce your issue". Very bad for confidence. The chips are OK but the development environment is the "crack", at least at the moment. It cost me lots of time and in this project also lots of money. For me, not recommendable to others in this state."
Couldn't agree more, perfectly stated.
- Mark as New
- Bookmark
- Subscribe
- Mute
- Subscribe to RSS Feed
- Permalink
- Report Inappropriate Content
I am in a similar situation with MCUX 11, as a workaround, you can mouse over code in the source window while paused at a breakpoint and it will show the value of the variable in the tooltip that pops up.
I also see that the "Modules" view of the debugger is always empty as well. I (would) use this quite a bit to track down the config of a module during debug...
- Mark as New
- Bookmark
- Subscribe
- Mute
- Subscribe to RSS Feed
- Permalink
- Report Inappropriate Content
And I actually did that on Friday, hovered over a structure to see its contents. But the yellow dialog took an exceedingly long time to populate, like, 20 seconds or so? And then I tried to single-step to the next line, and the debugger became unresponsive, I had to abort the session. The debugger just seems terribly unstable of late. I really don't remember having problems like these on earlier but still recent projects (1-2 years ago). And those were also C++ projects on Kinetis K24. It's just frustrating because this is a very capable toolchain and library set, and yet if I can't use the debugger effectively, it massively reduces the value (by ballooning our development costs).
- Mark as New
- Bookmark
- Subscribe
- Mute
- Subscribe to RSS Feed
- Permalink
- Report Inappropriate Content
FWIW, I'm now debugging a C++ project on a Kinetis K66, and I'm seeing the exact same issue. I'm using the J-Link OpenSDA adapter on a FRDM-K66F, and I paused the project. Given that I manually enabled the FreeRTOS plugin, I was able to see my threads running. I went into a thread that was blocked on a FreeRTOS stream buffer, and then examined the program state at various points in the call stack. It didn't matter where in the call stack I examined the task state; the Variables view was completely empty, even inside non-static object methods and regular C functions with local variables.
Your debugger is pretty much useless at this point.
- Mark as New
- Bookmark
- Subscribe
- Mute
- Subscribe to RSS Feed
- Permalink
- Report Inappropriate Content
We are looking into this, but so far we haven't been able to replicate the behaviour you are reporting.
Regards,
MCUXpresso IDE Support
- Mark as New
- Bookmark
- Subscribe
- Mute
- Subscribe to RSS Feed
- Permalink
- Report Inappropriate Content
OK, this issue is getting weirder. On several occasions I've noticed that the Variables view is not showing anything, even when there are parameters or local variables present. I wasn't sure what was causing this, because other times it seems I'm able to get variables to show up.
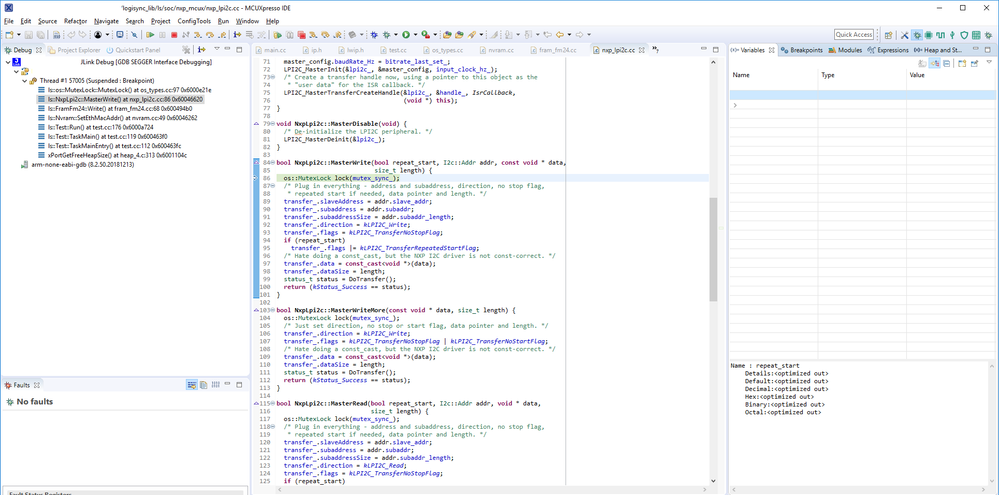
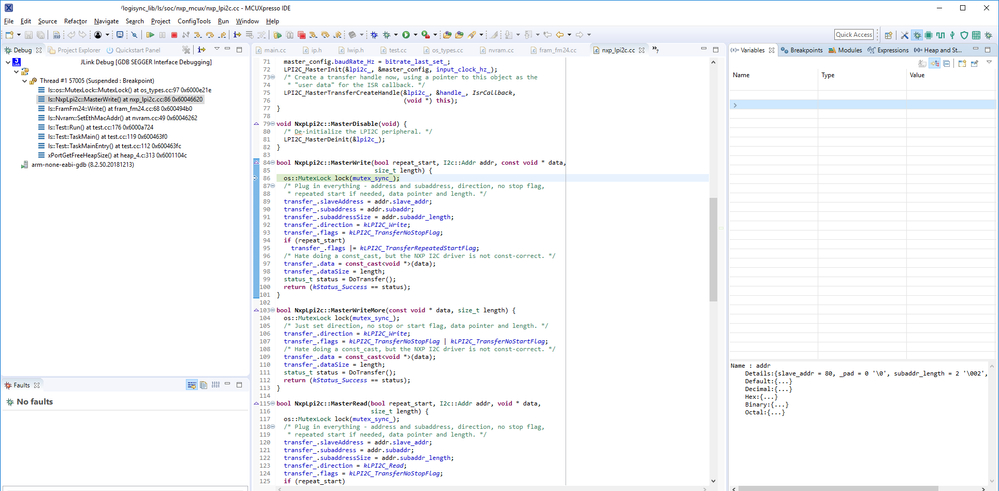
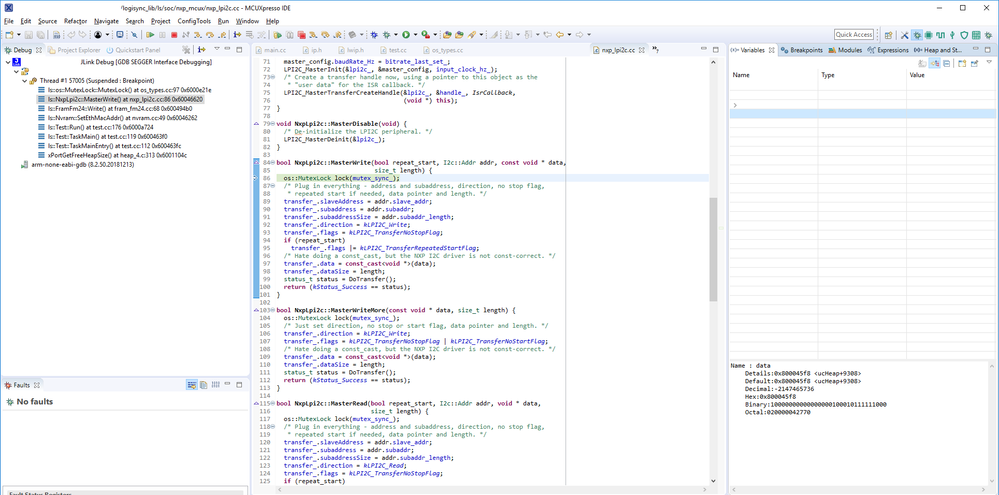
Well, it turns out that sometimes the variables are there, you just can't see them. Have a look at these three screenshots:
Notice which line of the Variables table is highlighted in blue, and the details that appear in the window below. Clearly, the IDE believes that certain variables are in the table, because I can click on a row and see the details, but it's not actually displaying them. I can even click and turn the dropdown arrow for the I2c::Addr addr object parameter, though when I do that, the line below gives no details (the next line after that, however, is "data" as expected). Also, for whatever reason, if I click the top row in the table, the details don't change (they stay on whatever they were previously). That's normally (I think) the line I'd expect to have a "this" dropdown for the current object.
So... what the heck is going on with the Variables view?
- Mark as New
- Bookmark
- Subscribe
- Mute
- Subscribe to RSS Feed
- Permalink
- Report Inappropriate Content
After some more experiments with the IDE on IMXRT1050, we still haven't been able to reproduce the weird behavior of the Variables view when it comes to displaying variables. It would be useful to describe all the steps you perform that put the IDE in that state. I tried various scenarios involving run control operations, used breakpoints in various places, opened/closed/switched various views, activated/deactivated "live variables" support for Global Variables, "watched" variables using the "live variables" support. Keep in mind that we used a basic C++ app.
Regarding the issue with 'this' pointer, our understanding is that there’s no ‘this’ variable because that’s the expected result. We're just guessing based on the screenshots because we don't have your code. Basically, there's a static ‘CreateInstance’ method inside ‘NxpLpi2c’ class that ends-up instantiating a new ‘NxpLpi2c’ class. There shouldn’t be any ‘this’ in that static method if our assumption is correct.
As far as the variables suffixed with '@entry' are concerned, their presence is also expected. More on this topic can be found in GDB’s documentation - https://sourceware.org/gdb/onlinedocs/gdb/Variables.html.
Greetings,
MCUXpresso IDE Support
- Mark as New
- Bookmark
- Subscribe
- Mute
- Subscribe to RSS Feed
- Permalink
- Report Inappropriate Content
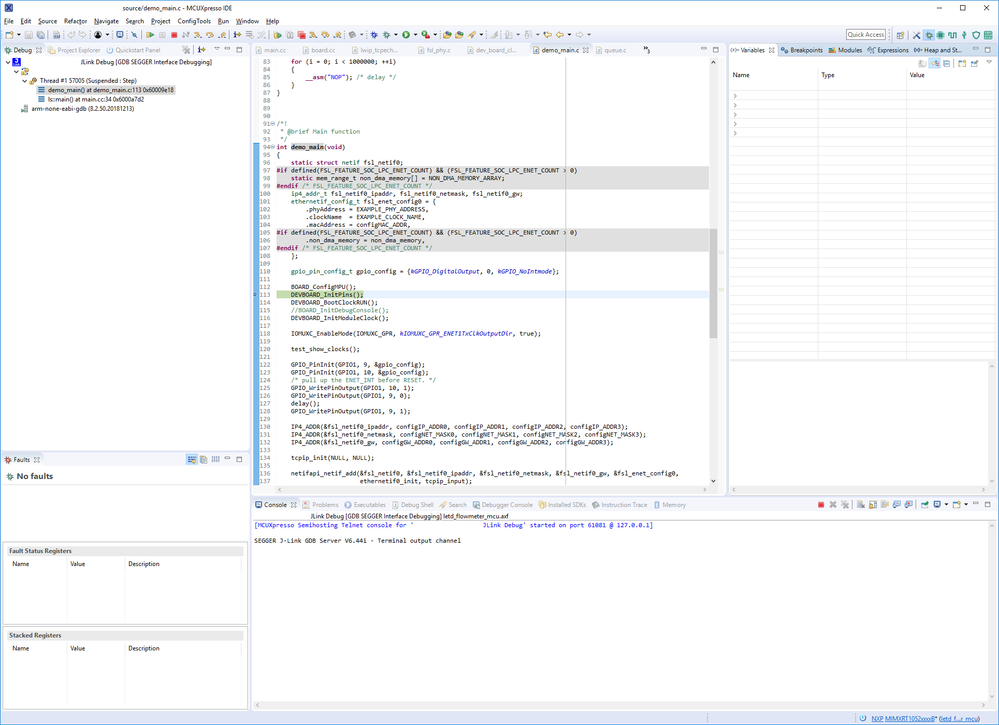
All I'm doing is building my project and launching the debugger, and I wind up with a screen like this (from five minutes ago):
I mean, these are the only steps I've taken:
1) Make a copy of the "Debug" perspective, calling it "Debug (Custom)", and deleting a few tabs like Global Variables (which, yes, still creates a 1-2 minute delay if it exists at the time I click Debug). I make a copy of this perspective because then the IDE doesn't automatically re-add that tab to my custom perspective every time I launch a debug session, like it does with the standard "Debug" perspective.
2) Shift-click on the blue bug to create a new debug configuration (in this case I'm using a SEGGER pod with my EVKB, but the CMSIS-DAP doesn't change the behavior).
3) Let the debug session launch.
4) Start single-stepping through the code. Observe that the Variables window remains blank, though dropdown arrows appear for structures and objects. Clicking one of these lines will (usually, not always) cause details to appear in the white box below.
Right now, this is the biggest impediment to debugging. Being unable to examine variables or dive into structures is crippling my ability to debug my application; I'm pretty much relying on printf() and watching if/then branching to figure out what my program is doing.
Regarding "this"... dang it, you're right, "this" won't appear when debugging a static method. Should have realized that earlier. So yeah, the topic of this thread is a bit of a red herring at this point... the biggest issue is why the Variables tab is not rendering.
I mean, I'm not surprised that you're having difficulty reproducing the issue... if your developers had encountered this issue during IDE development, I'm sure it would have been one of the first things flagged and fixed. But that doesn't help me any. I've been using CW for MCU, KDS, and now MCUX since forever, and this is the first time I've ever encountered this issue. But it's 100% reproducible on my machine (it persists through IDE restarts and system restarts). Don't know what else to tell you.
- Mark as New
- Bookmark
- Subscribe
- Mute
- Subscribe to RSS Feed
- Permalink
- Report Inappropriate Content
Since you're saying that you created a new perspective and removed Global Variables view, we'll be trying to follow this path and see where it takes us. Maybe these are the keys to reproduce your problem.
Meanwhile, would you please try the following and see if any of these suggestions help?
1. Close the Variables view and then Reset your perspective (Window => Perspective => Reset Perspective). Maybe also switch to some other views that are in the same tabbed folder with the Variables view and then switch back.
2. Add/remove columns in Variables view (Click the down arrow in the view => Layout => Show Columns or Select Columns)
3. Select other stack frames in Debug view to trigger updates of the view.
4. Simply close and reopen Variables view.
Please let us know if any of the suggestions help.
Greetings,
MCUXpresso IDE Support
- Mark as New
- Bookmark
- Subscribe
- Mute
- Subscribe to RSS Feed
- Permalink
- Report Inappropriate Content
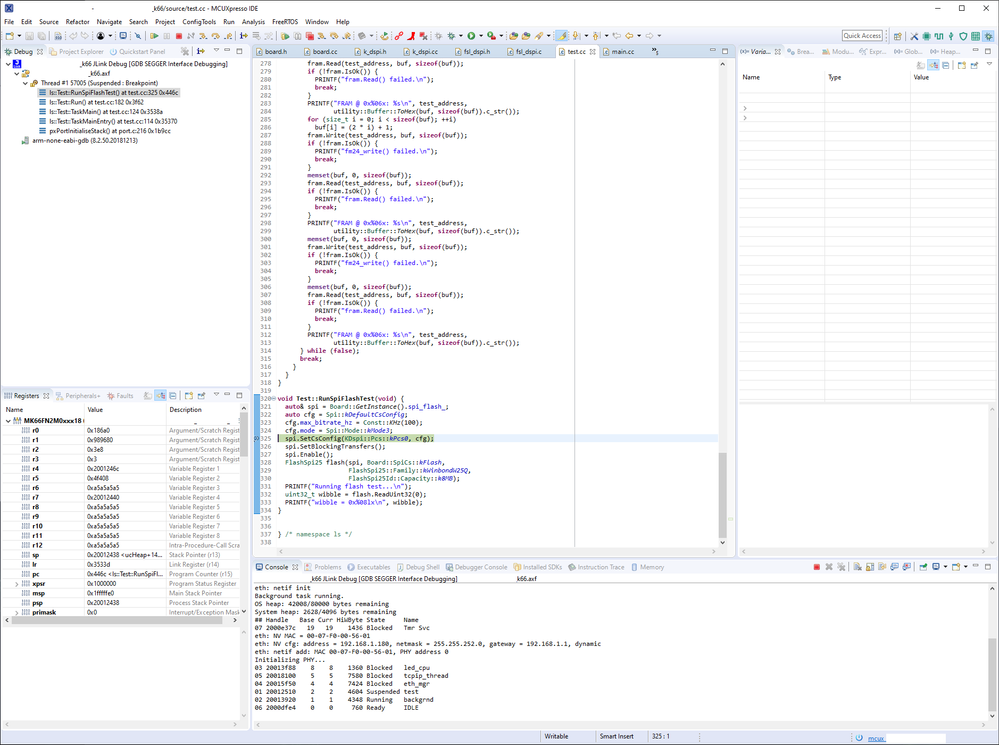
Thought that I had replied to this directly, apparently I did not. So I tried each thing that you suggested, and did not manage to get the Variables view to work. Tried #1 just now (close Variables, reset the Debug perspective). I even deleted my customized copy of the Debug perspective that I've been using to get around the "2%" delay issue. No dice. After resetting the debug perspective, I cleared all breakpoints, started the debug on my FRDM-K66F, waited for the debugger to pause at main(), set one breakpoint inside a test method in an object, set the program to run, then pressed a key on the UART to trigger the test method. The debugger hit the breakpoint, and here's what I see:
See those two chevrons/angle brackets in the Name column? Those are almost certainly intended for the "spi" and "cfg" objects in the RunSpiFlashTest() method. So the IDE sorta knows what's supposed to go in those spots, but it's not rendering anything, maybe because it's being horribly slow to load data (pure speculation on my part). Worse, after I let the IDE sit there on this breakpoint for about a minute, I press F6 to step over, and nothing happens. I wait another minute, press F6 again, nothing happens. I click Run / Step Over from the menu bar, nothing happens. Although strangely, a third chevron appears at some point during all that.
Tried #2, excluding columns... no dice. I remove all but the Name column, and I just have a blank column with two chevrons. Which yes, I can expand/collapse, though only one blank row appears below the first chevron.
Tried #3 on multiple occasions last week and just now... I can't see variables anywhere in the call stack (extremely frustrating when trying to debug a driver).
Tried #4... turning Variables off and back on again did nothing, still blank.
None of this is working.
- Mark as New
- Bookmark
- Subscribe
- Mute
- Subscribe to RSS Feed
- Permalink
- Report Inappropriate Content
I am seeing the same issue in MCUXpresso 11.0.
The Variables view is quite often empty! Sometimes it is populated, sometimes empty and sometimes it will magically pop up a few of the variables later on.
- Mark as New
- Bookmark
- Subscribe
- Mute
- Subscribe to RSS Feed
- Permalink
- Report Inappropriate Content
I was excited to try out 11.0.
My issue with 11.0 running on Windows 10 is when I hover over a variable, the pop-up window shows no information at all, just a grid.
This is probably a corollary to the missing variables problem.
This is a c++ project. I am using Segger J-link.
I had no problems seeing variables under 10.3. This is an 'upgraded' project. I created a new workspace, but kept the .project and .cproject from 10.3
Hope this helps.
- Mark as New
- Bookmark
- Subscribe
- Mute
- Subscribe to RSS Feed
- Permalink
- Report Inappropriate Content
I can confirm and add to that... I've seen the same issue, where a blank grid pops up, BUT I have seen at least one instance where after hovering (rough estimate) 20 seconds or so, the grid actually populates with values. Unfortunately by that point, it seems the debugger has lost its place, because any attempt to step into, step over, or simply resume execution fails.
- Mark as New
- Bookmark
- Subscribe
- Mute
- Subscribe to RSS Feed
- Permalink
- Report Inappropriate Content
The hover is blank when the debugger first stops at the first breakpoint. I typed 'info variables' as suggested above by NXP.
There was a delay, but the very long list of variables displayed. I then 'stepped' and the hover showed variables.
In a previous session the 'step in', 'step out', etc. seemed frozen and unresponsive.
I looked at the 'gdb traces' There were errors 'unable' to read address. One of the addresses was in the range of 0x90000000. I am working on a K22. This is a bad address.
BTW, what is Redlink? I see this as 'new' console. It has just a few lines, Probe Status, exit.
- Mark as New
- Bookmark
- Subscribe
- Mute
- Subscribe to RSS Feed
- Permalink
- Report Inappropriate Content
Well, at least I'm not the only one. Thanks for letting me know you're seeing exactly what I'm seeing. Yanno, I'm gonna edit the title of this post to better represent the issue I'm actually running into.
- Mark as New
- Bookmark
- Subscribe
- Mute
- Subscribe to RSS Feed
- Permalink
- Report Inappropriate Content
We've not noticed any issues with "this" not being displayed when debugging C++ code here (though admittedly with simpler examples than your code).
But all the Variables view effectively does is call the underlying GDB function to display locals.
What do you see if you switch to the Debugger Console view and enter the following two commands:
info locals
info args
Is "this" in the list anywhere?
It might also be worth looking in the "gdb-traces" entry in the Console view, and seeing if this gives you any clues as to what might be happening.
Regards,
MCUXpresso IDE Support
- Mark as New
- Bookmark
- Subscribe
- Mute
- Subscribe to RSS Feed
- Permalink
- Report Inappropriate Content
There's something wrong with the Variables view in MCUX 11.0.0, that wasn't wrong in previous versions. I still see no trace of "this", but what's more troubling is that much of the time, I don't see ANY variables listed, in functions that clearly have arguments and/or locals.
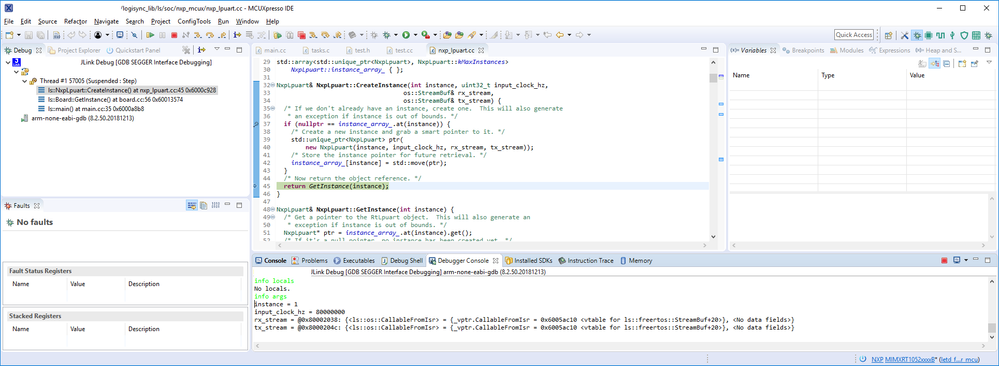
I did what you suggested and went into the Debugger Console to inspect the "locals" and "args". Here's what I saw on my first run:
GDB clearly knows that there are arguments to this function, but nothing is listed in the Variables view. FWIW, this code was build with -O0 (optimization level zero). Since I've done most of my previous debugging with -Og (optimize for debug), I switched to that, rebuilt, and tried again. Initially I again couldn't see anything in the Variables view. Then for giggles, I clicked on the Breakpoints tab, then on the Modules tab, then back to the Variables tab, and suddenly I got some stuff to show up there:
Still no "this", but now I have two copies of "instance" (one @entry version, whatever that means), and two copies of "input_clock_hz". The "args" display in the console looks to be what I would expect, as does "locals", save for the absence of "this". Does this help you at all?

