- NXP Forums
- Product Forums
- General Purpose MicrocontrollersGeneral Purpose Microcontrollers
- i.MX Forumsi.MX Forums
- QorIQ Processing PlatformsQorIQ Processing Platforms
- Identification and SecurityIdentification and Security
- Power ManagementPower Management
- MCX Microcontrollers
- S32G
- S32K
- S32V
- MPC5xxx
- Other NXP Products
- Wireless Connectivity
- S12 / MagniV Microcontrollers
- Powertrain and Electrification Analog Drivers
- Sensors
- Vybrid Processors
- Digital Signal Controllers
- 8-bit Microcontrollers
- ColdFire/68K Microcontrollers and Processors
- PowerQUICC Processors
- OSBDM and TBDML
-
- Solution Forums
- Software Forums
- MCUXpresso Software and ToolsMCUXpresso Software and Tools
- CodeWarriorCodeWarrior
- MQX Software SolutionsMQX Software Solutions
- Model-Based Design Toolbox (MBDT)Model-Based Design Toolbox (MBDT)
- FreeMASTER
- eIQ Machine Learning Software
- Embedded Software and Tools Clinic
- S32 SDK
- S32 Design Studio
- Vigiles
- GUI Guider
- Zephyr Project
- Voice Technology
- Application Software Packs
- Secure Provisioning SDK (SPSDK)
- Processor Expert Software
-
- Topics
- Mobile Robotics - Drones and RoversMobile Robotics - Drones and Rovers
- NXP Training ContentNXP Training Content
- University ProgramsUniversity Programs
- Rapid IoT
- NXP Designs
- SafeAssure-Community
- OSS Security & Maintenance
- Using Our Community
-
-
- Home
- :
- Software Forums
- :
- S32 Design Studio Knowledge Base
- :
- HOWTO: Start S32 Debugger on an ISP Application Project with S32 Debug Probe
HOWTO: Start S32 Debugger on an ISP Application Project with S32 Debug Probe
- Subscribe to RSS Feed
- Mark as New
- Mark as Read
- Bookmark
- Subscribe
- Printer Friendly Page
- Report Inappropriate Content
HOWTO: Start S32 Debugger on an ISP Application Project with S32 Debug Probe
HOWTO: Start S32 Debugger on an ISP Application Project with S32 Debug Probe
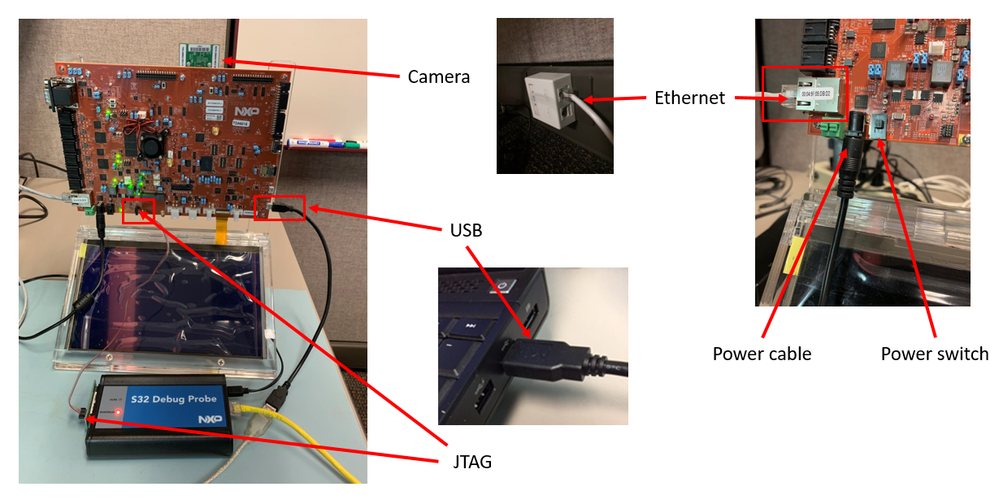
1) Prepare the evaluation board hardware
- You can use the S32 Debug Probe to download code to target
- Connect S32 Debug Probe to S32V234 EVB2 using JTAG connector
- Connect S32 Debug Probe to PC via USB cable OR ethernet (if connected via ethernet, then USB power cable must also be connected)
- Connect the S32V234 EVB2 to PC via ethernet (typically via LAN)
- Connect power cable to evaluation board and switch on the power
2) Build the project using the A53 build option.
3) The project is now built, and the ELF file is ready to be loaded to the EVB for execution. Before a debug session can be started, we must complete HOWTO: Setup A Remote Linux Connection in S32DS (S32V234).
Start A53 Debug
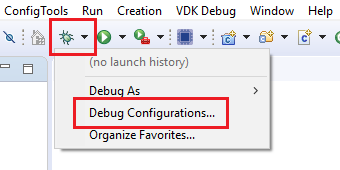
4) Select the debug drop-down menu and click Debug Configurations
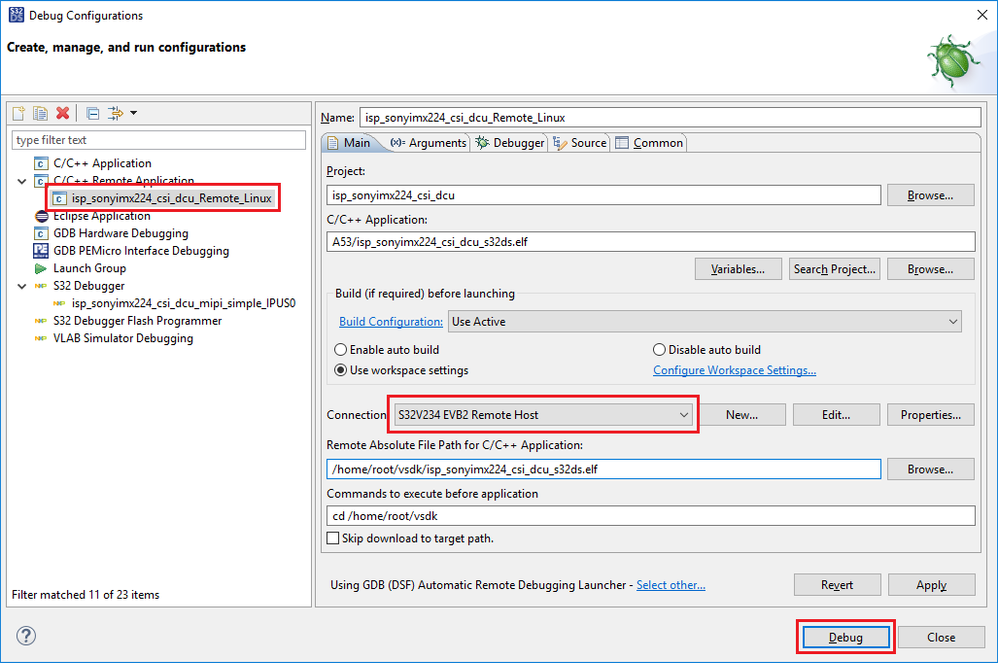
5) Make sure the '{project_name}_Remote_Linux' debug configuration is selected and the Connection (see step 3) is selected (points to the IP address of your EVB). Click Debug
6) The first time you connect to a new IP address (i.e. the first time you debug after creating a new workspace), you will receive a warning message, Click Yes and proceed.
The executable file is copied to Linux file system and gdbserver starts.
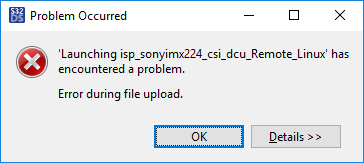
You may get an error message on the first try, this is normal. Just try it again and it will work.
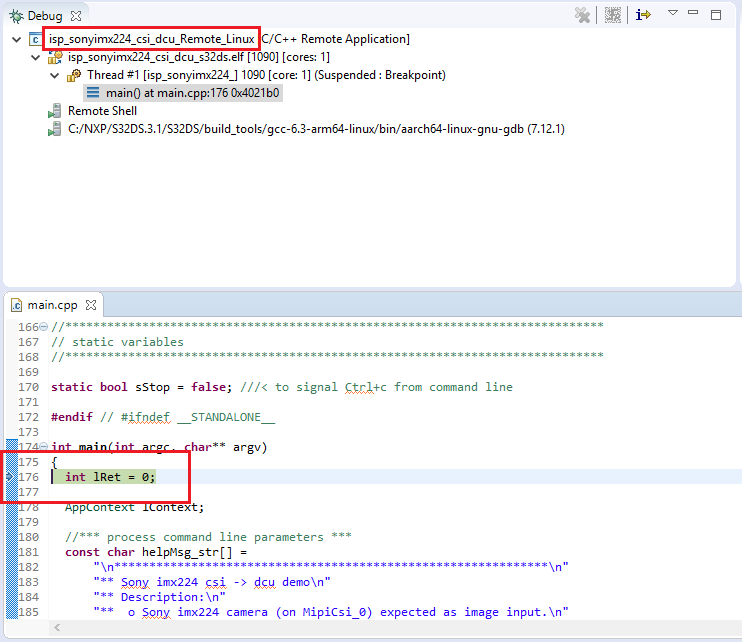
7) Once the Linux GDB has started on A53 core and the initial break point is reached in main(), it is almost ready for to start debug on ISP. Click Resume as the A53 must be running before we can attach the ISP debug thread.
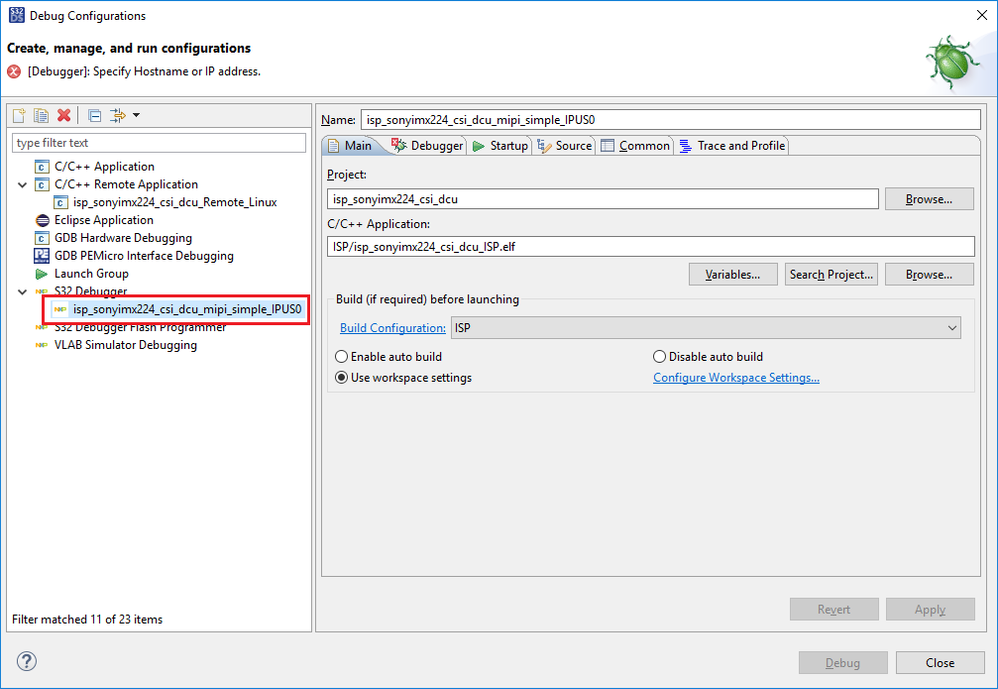
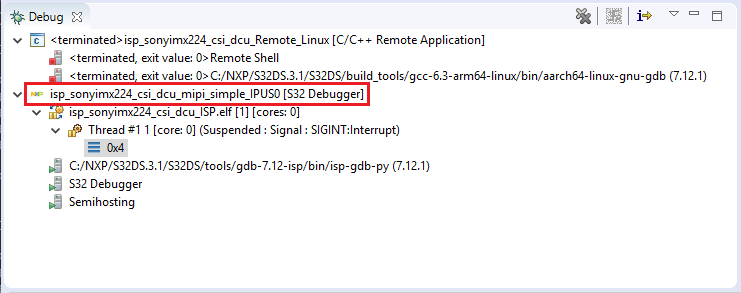
8) Return to the Debug Configurations menu and locate the ISP debug configuration. You will see a debug configuration within the 'S32 Debugger' group (in our example, isp_sonyimx224_csi_dcu_mipi_simple_IPUS0 as shown below). This is the debug configuration we will use, however, it will require some setup.
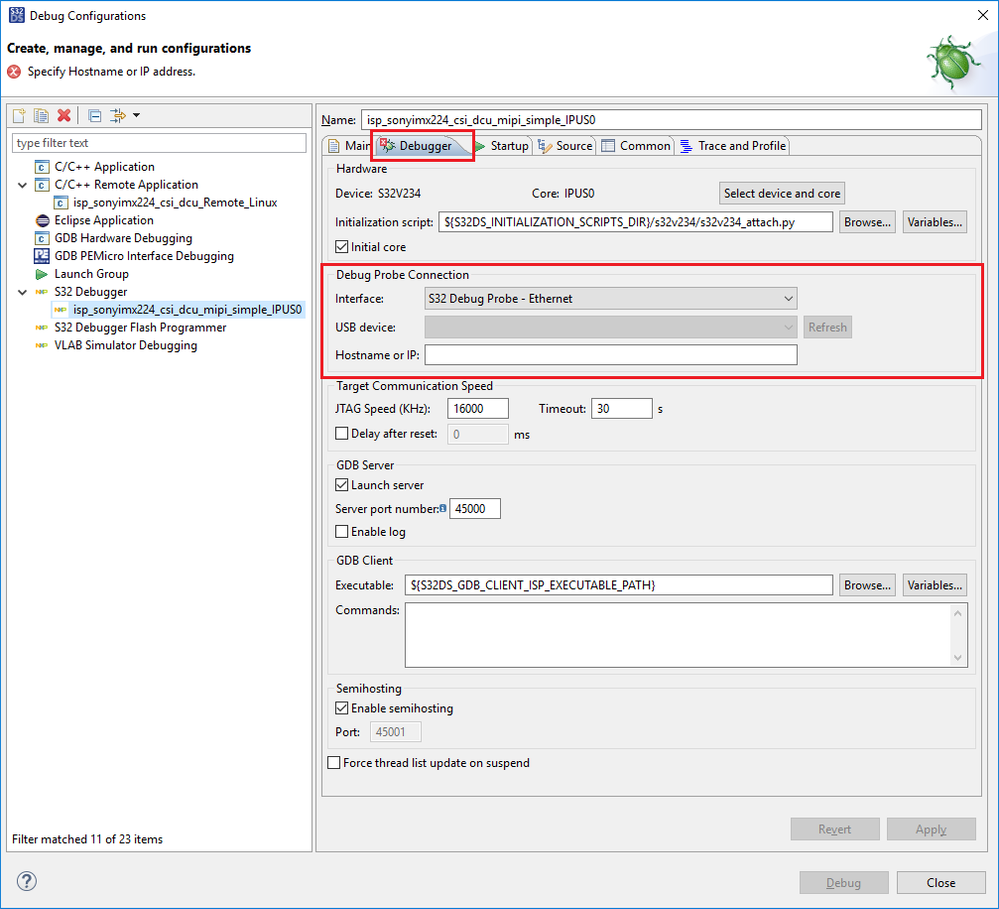
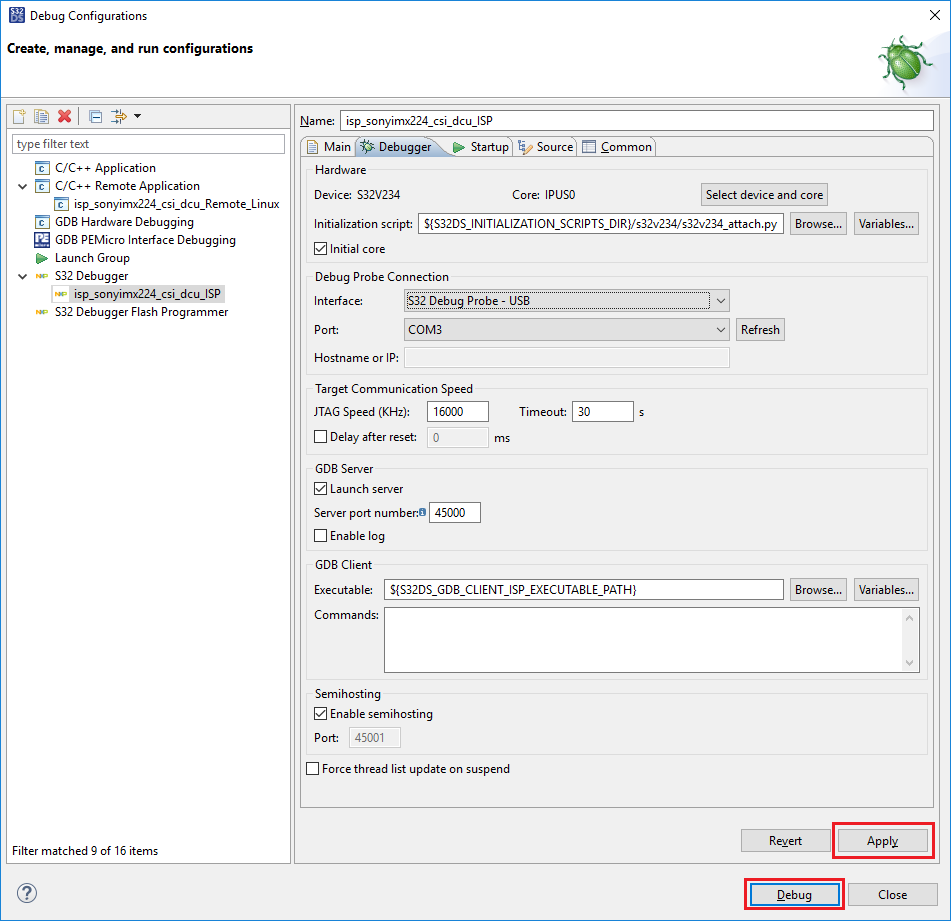
9) You should notice the error message at the top of the window, just below the title and a red 'X' on the Debugger tab. Click on the Debugger tab to select it. We must setup the Debug Probe Connection before we can proceed.
There are two options:
- Ethernet
- USB
If connecting the Probe via Ethernet, please refer to the Quick Start Guide or S32 Debug Probe User Guide provided with the S32 Debug Probe for instructions on how to connect it and determine the Hostname or IP address.
If connecting the Probe via USB, then the COM port will appear in the Port selection setting. If you have more than one S32 Debug Probe connected, you will need to determine which COM port is the correct one, otherwise, only the COM port for your S32 Debug Probe will appear.
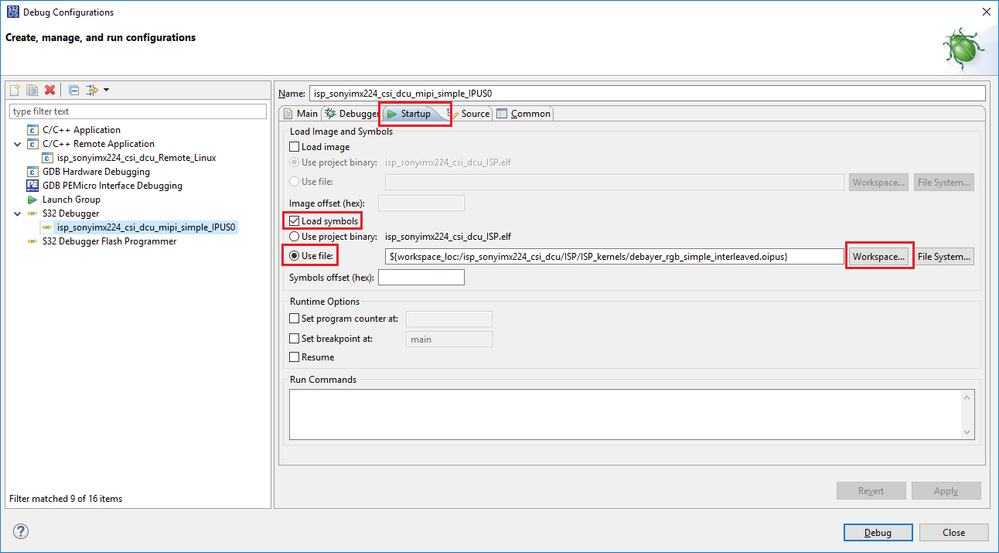
10) This is already done for our example, but for your application, it may be necessary to setup the symbols for the ISP engine. Go to the Startup tab and:
a) Check the box for 'Load symbols'
b) Select the option for 'Use file', click Workspace... and locate the object file (.opius) for the ISP engine you wish to debug.
11) Click Apply then Debug. It may take a few moments for the ISP core debug to launch.
12) Wait for the ISP debug launch to complete. You may notice the A53 thread has terminated. This is normal and expected since the camera input cannot be suspended. When the launch completes, the context of the Debug window will switch to the ISP debug thread.
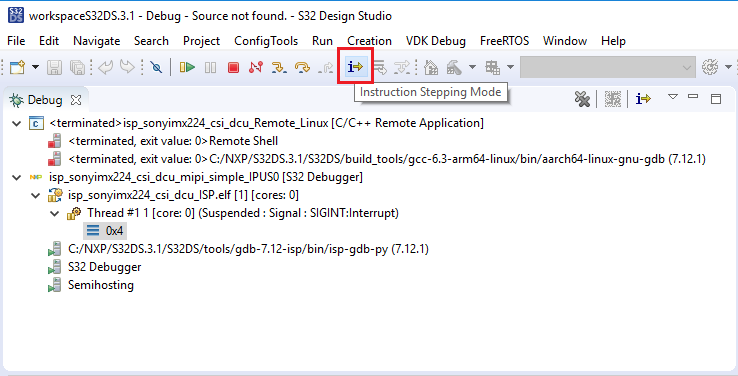
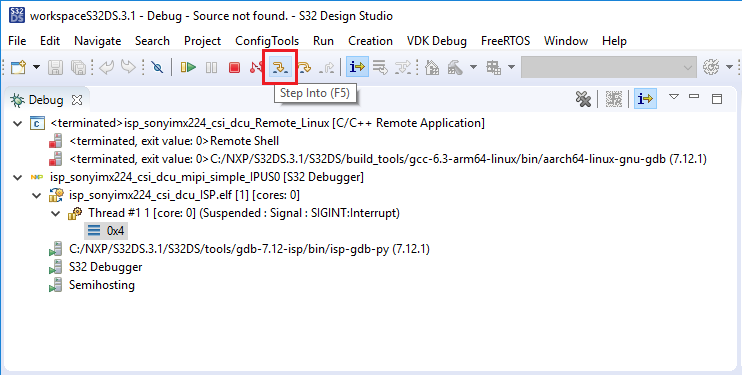
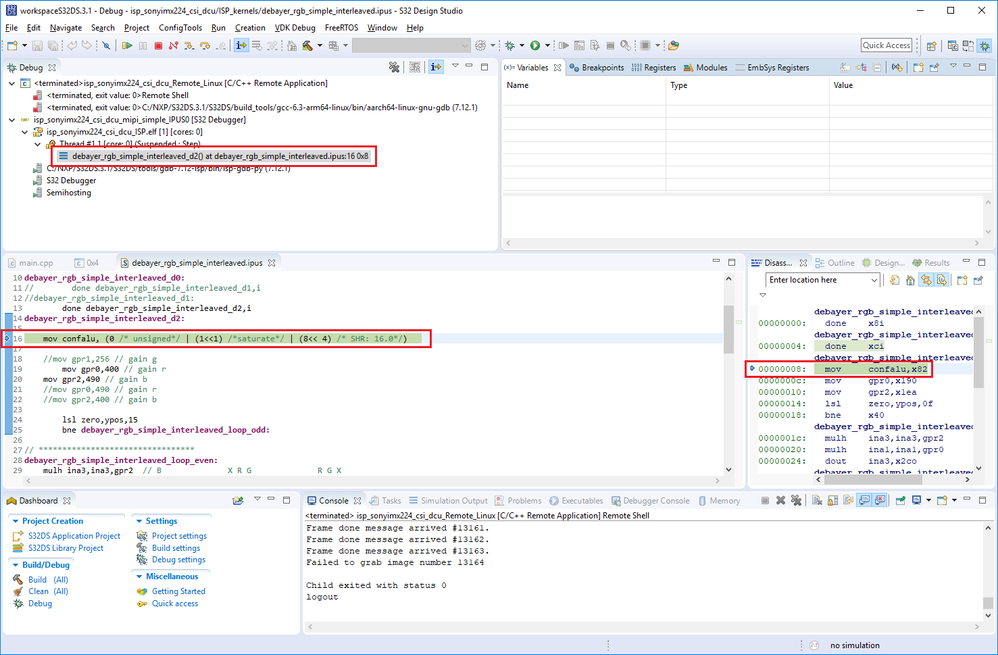
13) Enable Instruction Stepping mode and then step one time to load the object file which was setup in step 6.
14) The ISP debugging is now running and you can step through the ISP engine, look at registers, set a break point, etc. Note: only one hardware break point is supported for ISP.
